. 2015 Feb;73(2):809-17.
doi: 10.1002/mrm.25156. Epub 2014 Mar 19.

Rapid and accurate T2 mapping from multi-spin-echo data using Bloch-simulation-based reconstruction

Affiliations

Rapid and accurate T2 mapping from multi-spin-echo data using Bloch-simulation-based reconstruction

Noam Ben-Eliezer et al. Magn Reson Med. 2015 Feb.

Abstract

Purpose: Quantitative T2 -relaxation-based contrast has the potential to provide valuable clinical information. Practical T2 -mapping, however, is impaired either by prohibitively long acquisition times or by contamination of fast multiecho protocols by stimulated and indirect echoes. This work presents a novel postprocessing approach aiming to overcome the common penalties associated with multiecho protocols, and enabling rapid and accurate mapping of T2 relaxation values.

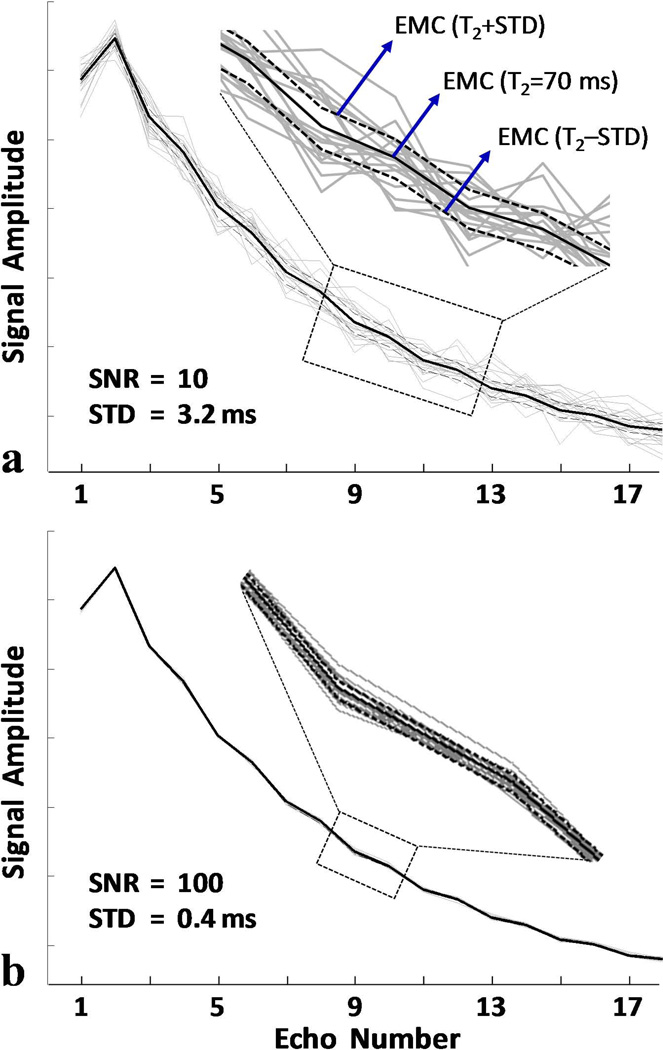
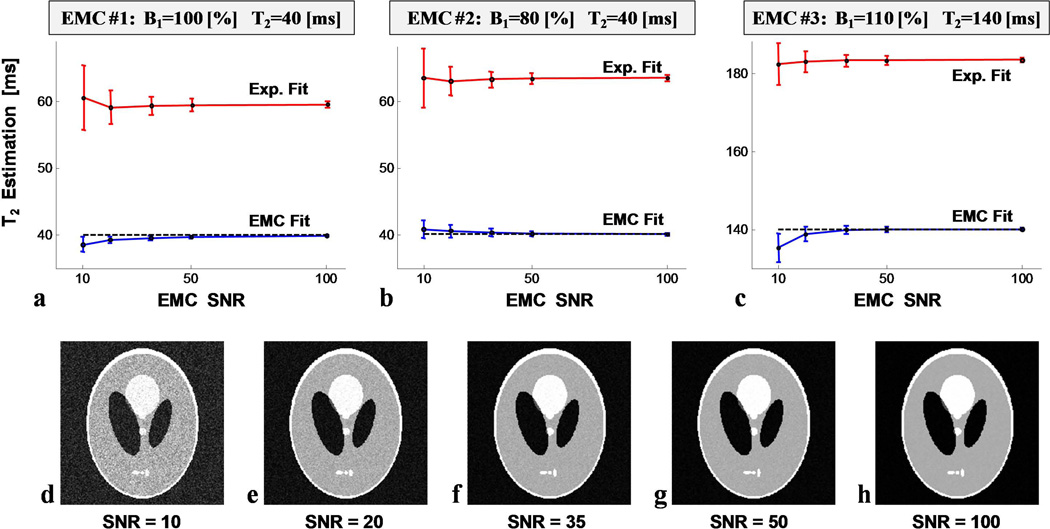
Methods: Bloch simulations are used to estimate the actual echo-modulation curve (EMC) in a multi-spin-echo experiment. Simulations are repeated for a range of T2 values and transmit field scales, yielding a database of simulated EMCs, which is then used to identify the T2 value whose EMC most closely matches the experimentally measured data at each voxel.

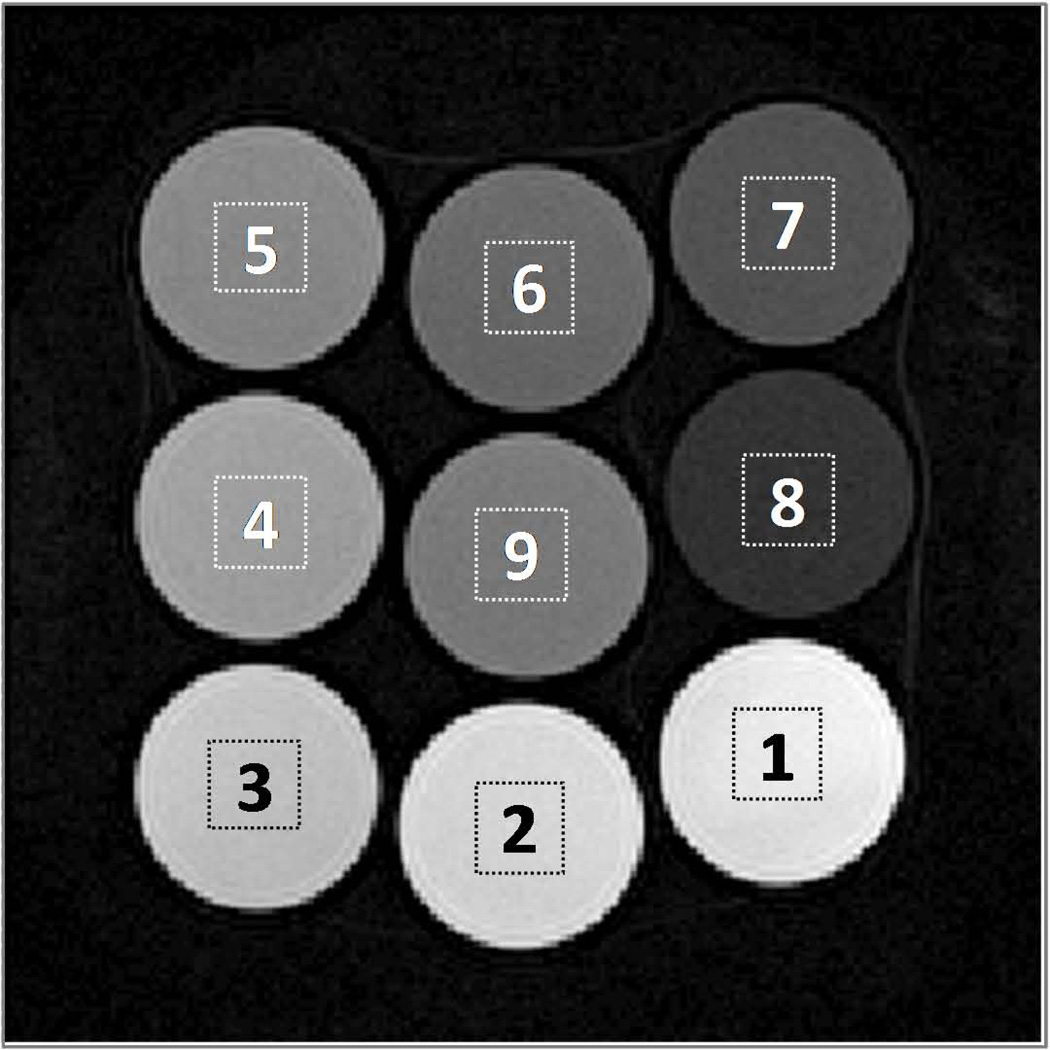
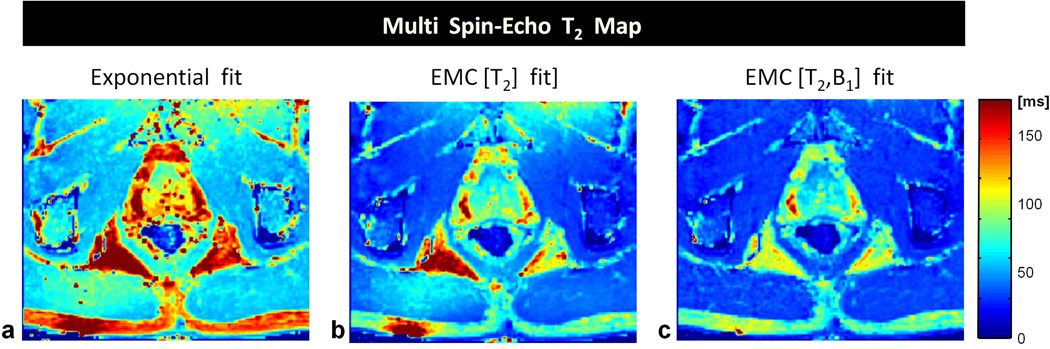
Results: T2 maps of both phantom and in vivo scans were successfully reconstructed, closely matching maps produced from single spin-echo data. Results were consistent over the physiological range of T2 values and across different experimental settings.

Conclusion: The proposed technique allows accurate T2 mapping in clinically feasible scan times, free of user- and scanner-dependent variations, while providing a comprehensive framework that can be extended to model other parameters (e.g., T1 , B1 (+) , B0 , diffusion) and support arbitrary acquisition schemes.

Keywords: T2 mapping; quantitative MRI.


Figures

Figure 1
Figure 1
Simulation of the T2 bias when fitting a multi spin-echo decay curve to an exponential model of the form S(t) = S0exp(−t/T2). The bias ranges from 41% to more than a 100% with respect to the underlying baseline value, and reflects the deviation of a multi-echo modulation curve from a theoretical exponential decay as a result of stimulated and indirect echoes. The relative error varies primarily as a function of baseline T2 value and transmit flip angle, with secondary contributions from other experimental parameters delineated in the text. Simulations compared one-dimensional multi- versus single- spin-echo pulse-sequences, assuming perfectly homogeneous B0 distribution and no diffusion effects. Simulation parameters were TE=[15,30,…,150] ms (NTE=10), BWacq=200Hz/Px, αRefocusing=[108°…198°], T1=2 sec, slice-thickness ratio of 1.2 between refocusing and excitation RF pulses. Further details are elaborated in the Methods section.
Figure 2
Figure 2
Examples of a simulated echo-modulation-curve (EMC) database for a multi SE protocol. (a) Simplified database containing two ranges of consecutive T2 values. (b) Full database, spanning T2 range of 1 to 300 ms and B1+ inhomogeneity scales of 60% to 120%. Both databases were down-sampled to half the actual T2 and B1+ resolutions for visualization purposes.
Figure 3
Figure 3
T2 weighted fast spin echo image of the nine-tube phantom used in this study. Tubes [1…8] were doped with varying concentrations of manganese chloride (MnCl2) imparting each tube a different T2 relaxation time. Tubes #9 and #5 were prepared with similar concentrations in order to verify T2 mapping consistency over different spatial locations.
Figure 4
Figure 4
In vivo T2 maps of a human brain in a healthy adult volunteer. (a) T2 map derived from a single SE data set and fitted to an exponential decay curve of the form S(t) = S0exp(−t/T2). (b-c) T2 maps derived from a multi SE data set via (b): fitting to the same exponential model as in (a), or (c): matching to the database of simulated EMCs proposed in this report. (d) B1+ bias map, produced by the EMC fitting approach, and resulting from jointly fitting T2 and B1+ values. (e) Experimental decay curves for ROI #1 marked in panel (a), for single SE (blue) and for multi SE (red). Empty circles (black) show the simulated EMC that was matched to the experimental multi-echo decay curve. (f-g) Relative errors for the maps in (b-c), calculated as 100x[(b) – (a)]/(a) and 100x[(c) – (a)]/(a). (h) Quantitative T2 values in ROIs 1,2 and 3, for the maps shown in panels (a)-(c).
Figure 5
Figure 5
In vivo T2 maps of the human prostate in a healthy adult volunteer. Severe motion artifacts, corresponding mainly to involuntary bowel movements, caused strong pixel misalignment during a 32 min acquisition of a single SE data set and prevented reconstruction of a coherent T2 map. (a) T2 maps derived from a multi SE data set (total acquisition time = 5 min 20 sec) and fitted to a standard exponential curve of the form S(t) = S0exp(−t/T2). Overestimation of the T2 values is expected in this case due to elongation of the echo-decay curve by stimulated and indirect echoes. (b) Same data set as in (a) but matched to a database of simulated EMCs, constructed solely for a range of T2 values. (c) Same data as in (a) but subjected to a joint [T2,B1+] matching to a database of simulated EMCs, constructed for a range of T2 and B1+ values. The last panel clearly demonstrates the effectiveness of using a joint fit in avoiding transmit-sensitivity-related distortions of the T2 map.
Figure 6
Figure 6
Illustration of the noise analysis procedure for B1 = 100 %, T2 = 70 ms, at SNR levels of (a) 10 and (b) 100. Estimation of the EMC matching algorithm’s sensitivity to noise was performed through computer simulations by studying the matching process accuracy and precision at different noise levels. To that end, a representative echo-modulation curve (black solid line) was extracted from a simulated EMC database and then matched back to the database after adding noise at different SNR levels. The process was repeated N=128 times (gray solid lines), producing an estimate of the accuracy (mean value) and precision (standard deviation) for each [B1,T2,SNR] parameter set. Black dashed lines in the Figure represent EMCs at T2 values located one standard-deviation above and below the representative echo-modulation curve, graphically illustrating the standard deviation of the matching process under the given noise level.
Figure 7
Figure 7
EMC matching algorithm’s performance in the presence of noise. (a-c) Accuracy (mean value) and precision (one standard-deviation error bars) of T2 values, estimated using the EMC matching algorithm (blue) and conventional exponential fitting (red), as a function of EMC SNR for three representative [B1,T2] value pairs. Black dashed line shows the true underlying T2 value for each representative echo-modulation curve. (d-h) Images of a synthesized Shepp-Logan phantom at SNR levels corresponding to those shown in panels a-c.

References

    1. Ceccarelli A, Rocca M, Neema M, Martinelli V, Arora A, Tauhid S, Ghezzi A, Comi G, Bakshi R, Filippi M. Deep gray matter T2 hypointensity is present in patients with clinically isolated syndromes suggestive of multiple sclerosis. Mult Scler. 2010;16(1):39–44. - PubMed
    1. Lund H, Jønsson A, Andersen J, Rostrup E, Paulson O, Sørensen P. Cognitive deficits in multiple sclerosis: correlations with T2 changes in normal appearing brain tissue. Acta Neurol Scand. 2012;125(5):338–344. - PubMed
    1. Roebuck J, Haker S, Mitsouras D, Rybicki F, Tempany C, Mulkern R. Carr-Purcell-Meiboom-Gill imaging of prostate cancer: quantitative T2 values for cancer discrimination. Magn Reson Imaging. 2009;27(4):497–502. - PMC - PubMed
    1. Liu W, Turkbey B, Sénégas J, Remmele S, Xu S, Kruecker J, Bernardo M, Wood B, Pinto P, Choyke P. Accelerated T2 mapping for characterization of prostate cancer. Magn Reson Med. 2011;65(5):1400–1406. - PMC - PubMed
    1. Farraher S, Jara H, Chang K, Ozonoff A, Soto JA. Differentiation of hepatocellular carcinoma and hepatic metastasis from cysts and hemangiomas with calculated T2 relaxation times and the T1/T2 relaxation times ratio. J Magn Reson Imaging. 2006;24(6):1333–1341. - PubMed

Publication types

MeSH terms

LinkOut - more resources