. 2014 Jul;88(13):7244-55.
doi: 10.1128/JVI.00203-14. Epub 2014 Mar 19.

Within-host evolution results in antigenically distinct GII.4 noroviruses

Affiliations

Within-host evolution results in antigenically distinct GII.4 noroviruses

Kari Debbink et al. J Virol. 2014 Jul.

Abstract

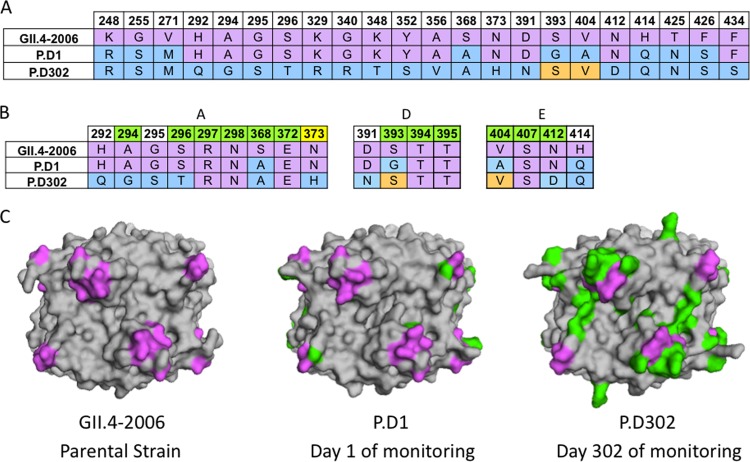
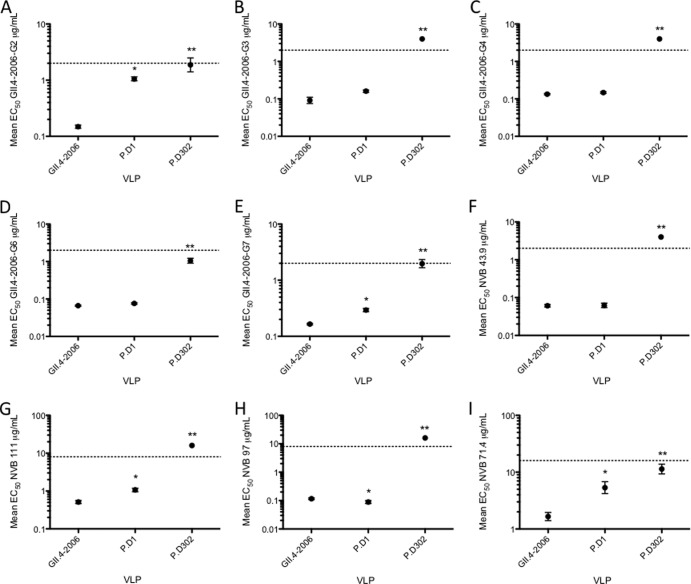
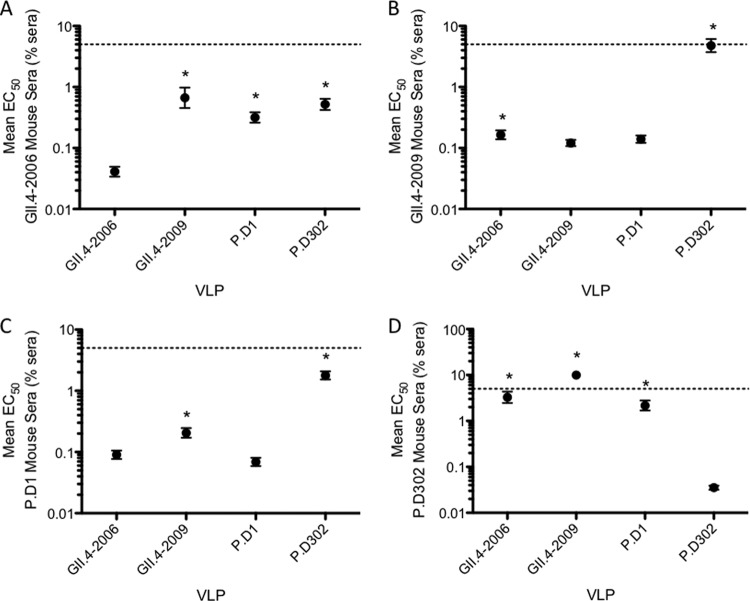
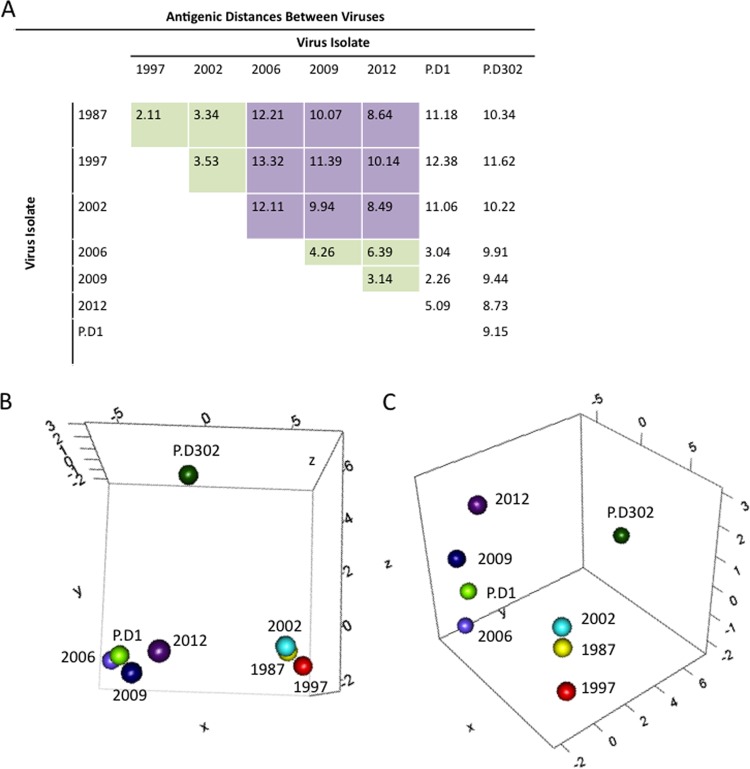
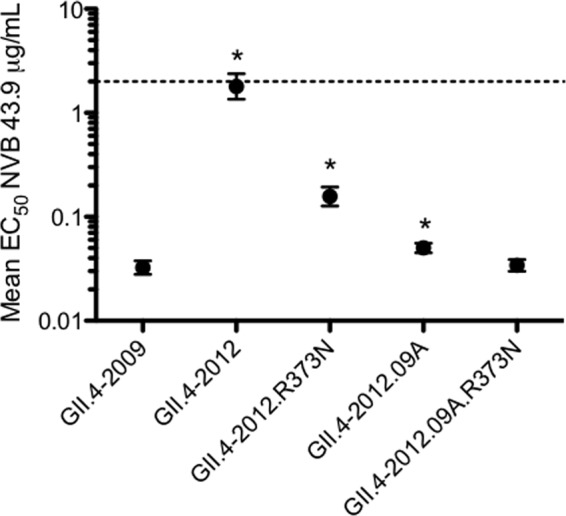
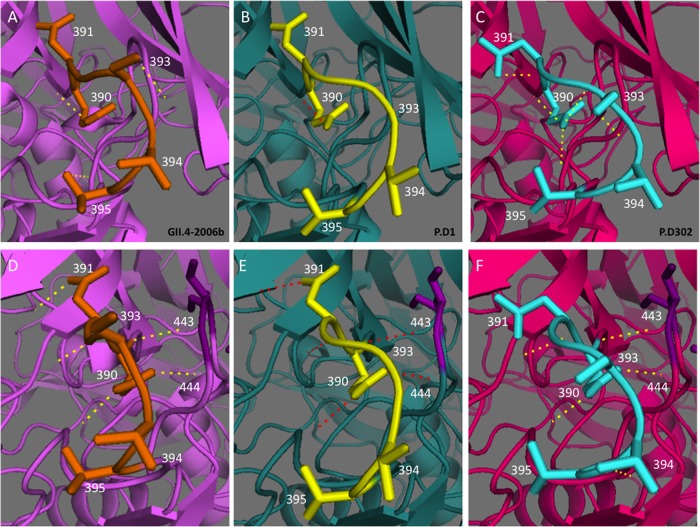
Genogroup II, genotype 4 (GII.4) noroviruses are known to rapidly evolve, with the emergence of a new primary strain every 2 to 4 years as herd immunity to the previously circulating strain is overcome. Because viral genetic diversity is higher in chronic than in acute infection, chronically infected immunocompromised people have been hypothesized to be a potential source for new epidemic GII.4 strains. However, while some capsid protein residues are under positive selection and undergo patterned changes in sequence variation over time, the relationships between genetic variation and antigenic variation remains unknown. Based on previously published GII.4 strains from a chronically infected individual, we synthetically reconstructed virus-like particles (VLPs) representing early and late isolates from a small-bowel transplant patient chronically infected with norovirus, as well as the parental GII.4-2006b strain. We demonstrate that intrahost GII.4 evolution results in the emergence of antigenically distinct strains over time, comparable to the variation noted between the chronologically predominant GII.4 strains GII.4-2006b and GII.4-2009. Our data suggest that in some individuals the evolution that occurs during a chronic norovirus infection overlaps with changing antigenic epitopes that are associated with successive outbreak strains and may select for isolates that are potentially able to escape herd immunity from earlier isolates.

Importance: Noroviruses are agents of gastrointestinal illness, infecting an estimated 21 million people per year in the United States alone. In healthy individuals, symptomatic infection typically resolves within 24 to 48 h. However, symptoms may persist for years in immunocompromised individuals, and development of successful treatments for these patients is a continuing challenge. This work is relevant to the design of successful norovirus therapeutics for chronically infected patients; provides support for previous assertions that chronically infected individuals may serve as reservoirs for new, antigenically unique emergent strains; and furthers our understanding of genogroup II, genotype 4 (GII.4) norovirus immune-driven molecular evolution.


Figures

FIG 1
FIG 1
Sequence changes in chronically infected patient strains compared to GII.4-2006b. (A) Available capsid amino acid sequences for GII.4-2006b, P.D1, and P.D302 were aligned using Clustal Omega, and sequence differences among GII.4-2006, P.D1, and P.D302 are shown. GII.4-2006b residues are shown in purple. P.D1 and P.D302 differences from GII.4-2006b are indicated in light blue, while orange indicates reversion to the GII.4-2006b residues. (B) Alignment of GII.4-2006b, P.D1, and P.D302 amino acid sequences in and around epitopes A, D, and E. Green indicates a position within a defined epitope, while white indicates nearby residues that may impact antigenicity in these epitopes. Yellow indicates an amino acid position newly defined as part of epitope A. (C) Structural homology models of GII.4-2006b, P.D1, and P.D302 capsid P2 dimers shown from a top view. Purple shows the locations of epitopes A, D, and E on the capsid P2 dimer, while green shows changed amino acid residues in P.D1 and P.D302 compared to GII.4-2006b.
FIG 2
FIG 2
GII.4 mouse and human MAb blockade responses against chronic-infection strains. (A to I) Mouse and human GII.4 monoclonal antibodies were assayed for the ability to block GII.4-2006b, P.D1, and P.D302 VLP interaction with carbohydrate ligand. The mean percent control binding (the percentage of the VLP bound to carbohydrate ligand in the presence of an antibody compared to the amount of VLP bound with no antibody present) of each VLP was fitted with a sigmoidal curve, and the mean EC50 (μg/ml) blockade titers for GII.4-2006b, P.D1, and P.D302 were calculated. The error bars represent 95% confidence intervals. The asterisks indicate that the mean EC50 blockade titer for the test VLP was significantly different from the mean EC50 for GII.4-2006b (P < 0.05) (*) or was significantly different from those of both GII.4-2006b and P.D1 (P < 0.05) (**). Monoclonal antibodies that did not block a particular VLP were assigned an EC50 of 2 times the upper limit of detection for statistical analysis and are shown on the graph as data points above the upper limit of detection (dashed lines). Statistics were calculated by one-way ANOVA with a Bonferroni posttest.
FIG 3
FIG 3
Blockade activity of mouse polyclonal sera against homotypic and heterotypic VLPs. Mice were immunized with VRPs expressing the capsid genes of GII.4-2006b, GII.4-2009, P.D1, and P.D302, and sera collected from the mice were tested for blockade activity against GII.4-2006b, GII.4-2009, P.D1, and P.D302 VLPs. Shown is the blockade activity of sera from mice immunized against GII.4-2006b (A), GII.4-2009 (B), P.D1 (C), and P.D302 (D) with homotypic and heterotypic VLPs. The mean percent control binding (the percentage of the VLP bound to carbohydrate ligand in the presence of sera compared to the amount of VLP bound with no serum present) of each VLP was fitted with a sigmoidal curve, and the mean EC50 (% sera) blockade titers for GII.4-2006b, GII.4-2009, P.D1, and P.D302 were calculated. The error bars represent 95% confidence intervals. *, the mean EC50 blockade titer for the test VLP was significantly different from the mean EC50 for the homotypic strain (P < 0.05). Sera that did not block a particular VLP were assigned an EC50 of 10% sera for statistical analysis and are shown on the graph as data points above the upper limit of detection (dashed lines). Statistics were calculated by one-way ANOVA with a Bonferroni posttest.
FIG 4
FIG 4
Antigenic cartography for GII.4 noroviruses. MDS was used to identify the antigenic relationships between different norovirus strains. (A) Euclidean antigenic distances between virus strains were calculated based on the EC50 efficacies of antisera raised against GII.4-1987, GII.4-2002, GII.4-2006b, GII.4-2009, P.D1, and P.D302 VLPs. The green squares represent distances within either the early (1987, 1998, and 2002) or late (2006, 2009, and 2012) virus groups. The purple squares show the distances between early and late virus groups. (B and C) We determined XYZ coordinates that maintain the underlying Euclidean distances between viruses while illustrating the relationships between GII.4 norovirus strains, with each map distance roughly corresponding to an ∼1.25-fold change in blockade response. (B) Early strains GII.4-1987 (yellow), GII.4-1997 (red), and GII.4-2002 (light blue) grouped together (lower right), and the late strains GII.4-2006b (light purple), GII.4-2009 (dark blue), and GII.4-2012 (dark purple) grouped together (lower left). P.D1 grouped with late strains, closest to GII.4-2006b, while P.D302 was separate from either late or early strains (top). (C) Side view of the same 3D graph as in panel B, showing the antigenic differences between strains.
FIG 5
FIG 5
Expansion of epitope site A. Epitope A targeting human GII.4 MAb 43.9 was assayed for its ability to block GII.4-2009 New Orleans, GII.4-2012 Sydney, GII.4-2012.09A, GII.4-2012.R373N, and GII.4-2012.09A.R373N VLP interaction with carbohydrate ligand. The mean percent control binding (the percentage of the VLP bound to carbohydrate ligand in the presence of an antibody compared to the amount of VLP bound with no antibody present) of each VLP was fitted with a sigmoidal curve, and the mean EC50 (μg/ml) blockade titers for all VLPs were calculated. The error bars represent 95% confidence intervals. Statistics were calculated by one-way ANOVA with Dunnett's posttest. *, the mean EC50 blockade titer was significantly different from that of GII.4-2009.
FIG 6
FIG 6
Comparison of epitope site D polar interactions among GII.4-2006 and chronic-infection strains. PyMOL was used to model the polar interactions within residues 390 to 395 (A to C) and interactions between these residues and surrounding residues (D to F). GII.4-2006b is shown in purple (A and D), P.D1 is shown in teal (B and E), and P.D302 is shown in pink (C and F). Residues 390 to 395 are shown in orange for GII.4-2006b, yellow for P.D1, and aqua for P.D302. The dotted lines represent structure-based predicted polar interactions. (D to F) The dark-purple residues represent positions that interact with HBGAs.

References

    1. Mattner F, Sohr D, Heim A, Gastmeier P, Vennema H, Koopmans M. 2006. Risk groups for clinical complications of norovirus infections: an outbreak investigation. Clin. Microbiol. Infect. 12:69–74. 10.1111/j.1469-0691.2005.01299.x - DOI - PubMed
    1. Murata T, Katsushima N, Mizuta K, Muraki Y, Hongo S, Matsuzaki Y. 2007. Prolonged norovirus shedding in infants ≤6 months of age with gastroenteritis. Pediatr. Infect. Dis. J. 26:46–49. 10.1097/01.inf.0000247102.04997.e0 - DOI - PubMed
    1. Okada M, Tanaka T, Oseto M, Takeda N, Shinozaki K. 2006. Genetic analysis of noroviruses associated with fatalities in healthcare facilities. Arch. Virol. 151:1635–1641. 10.1007/s00705-006-0739-6 - DOI - PubMed
    1. Johnston CP, Qiu H, Ticehurst JR, Dickson C, Rosenbaum P, Lawson P, Stokes AB, Lowenstein CJ, Kaminsky M, Cosgrove SE, Green KY, Perl TM. 2007. Outbreak management and implications of a nosocomial norovirus outbreak. Clin. Infect. Dis. 45:534–540. 10.1086/520666 - DOI - PubMed
    1. Kroneman A, Vega E, Vennema H, Vinje J, White PA, Hansman G, Green K, Martella V, Katayama K, Koopmans M. 2013. Proposal for a unified norovirus nomenclature and genotyping. Arch. Virol. 158:2059–2068. 10.1007/s00705-013-1708-5 - DOI - PMC - PubMed

Publication types

MeSH terms

Associated data