. 2014 May;25(10):1629-40.
doi: 10.1091/mbc.E13-10-0598. Epub 2014 Mar 19.

Casein kinase 1δ functions at the centrosome and Golgi to promote ciliogenesis

Affiliations

Casein kinase 1δ functions at the centrosome and Golgi to promote ciliogenesis

Yoshimi Endo Greer et al. Mol Biol Cell. 2014 May.

Abstract

Inhibition of casein kinase 1 delta (CK1δ) blocks primary ciliogenesis in human telomerase reverse transcriptase immortalized retinal pigmented epithelial and mouse inner medullary collecting duct cells-3. Mouse embryonic fibroblasts (MEFs) and retinal cells from Csnk1d (CK1δ)-null mice also exhibit ciliogenesis defects. CK1δ catalytic activity and centrosomal localization signal (CLS) are required to rescue cilia formation in MEFs(Csnk1d null). Furthermore, expression of a truncated derivative containing the CLS displaces full-length CK1δ from the centrosome and decreases ciliary length in control MEFs, suggesting that centrosomal CK1δ has a role in ciliogenesis. CK1δ inhibition also alters pericentrosomal or ciliary distribution of several proteins involved in ciliary transport, including Ras-like in rat brain-11A, Ras-like in rat brain-8A, centrosomal protein of 290 kDa, pericentriolar material protein 1, and polycystin-2, as well as the Golgi distribution of its binding partner, A-kinase anchor protein 450 (AKAP450). As reported for AKAP450, CK1δ was required for microtubule nucleation at the Golgi and maintenance of Golgi integrity. Overexpression of an AKAP450 fragment containing the CK1δ-binding site inhibits Golgi-derived microtubule nucleation, Golgi distribution of intraflagellar transport protein 20 homologue, and ciliogenesis. Our results suggest that CK1δ mediates primary ciliogenesis by multiple mechanisms, one involving its centrosomal function and another dependent on its interaction with AKAP450 at the Golgi, where it is important for maintaining Golgi organization and polarized trafficking of multiple factors that mediate ciliary transport.


Figures

FIGURE 1:
FIGURE 1:
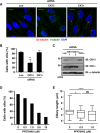
CK1δ mediates primary ciliogenesis in hTERT-RPE cells. (A) Representative confocal micrographs of hTERT-RPE cells treated with siRNA reagents targeting luciferase (negative control), CK1δ, or CK1ε. Acetylated tubulin antibody (red) highlights the cilium, γ-tubulin (green) is a centrosomal marker, and DAPI (blue) stains the nucleus. Overlap of acetylated tubulin and γ-tubulin signal is yellow. Bars, 10 μm. (B) Quantitative analysis of data in A. Bar graph and error bars represent mean ± SD from three independent experiments. **p = 0.007 (t test, compared with Luc siRNA). (C) Western blot analysis of CK1δ and CK1ε in hTERT-RPE whole-cell lysates 72 h after transfection with indicated siRNA reagents. Immunoblot of α-tubulin served as a loading control. (D) Dose-dependent effect of CK1δ/ε kinase inhibitor PF670462 on percentage of cells with primary cilium. Sample number N = 316, 117, 247, 78, and 217 cells examined in 0, 0.3, 1.0, 3.0, and 10 μM treatment groups, respectively. (E) Dose-dependent effect of PF670462 on ciliary length. Box represents middle 50% of values for ciliary length; line inside the box indicates median value; and whiskers show upper 25% and lower 25% of values. N = 99, 117, and 98 cells examined in 0, 0.3, and 1.0 μM treatment groups, respectively. One-way ANOVA, p < 0.0001; Tukey's test, *p = 0.0177, ****p < 0.0001, NS = not significant. See also Supplemental Figure S1.
FIGURE 2:
FIGURE 2:
Structure–function analysis of CK1δ using MEF model of primary ciliogenesis. (A) Representative confocal micrographs of cells stained to detect cilia. MEF cells homozygous for the floxed Csnk1d allele and infected with adenovirus expressing GFP (MEFCtl.) or Cre recombinase (MEFCsnk1d null) were processed to visualize the primary cilium. Markers are as described in the legend to Figure 1A. Bars, 5 μm. (B) Quantitative analysis of data in A. Number of cells with or without primary cilium is indicated. ****p < 0.0001 (Fisher's exact test). (C) Western blot analysis of CK1δ in MEFs homozygous for floxed Csnk1d allele and infected with adenovirus expressing GFP (Ctl.) or Cre recombinase. (D) Schematic diagram of CK1δ derivatives. Myc-tagged wild-type mouse CK1δ, kinase-inactive point mutant (K38A, marked with asterisk), C-terminal truncation mutant (ΔC), and EGFP fusion protein containing the C-terminal domain with centrosomal localization signal (CLS). (E) Western blot analysis of CK1δ derivatives and EGFP-N1 expressed in MEFCsnk1d null cells. (F) Ciliary length in MEFCsnk1d null cells transfected with various CK1δ derivatives or EGFP-N1 control construct. N = 106, 93, 55, 46, 47, 50, and 51 cells for treatment groups from left to right. One-way ANOVA, p < 0.0001; Tukey's test, ****p < 0.0001, NS = not significant. (G) Ciliary length in MEFCtl. cells transfected with EGFP-N1 or the EGFP fusion proteins containing the C-terminal domain of CK1δ vs. CK1ε. N = 30, 30, and 41 cells for Ctl., δCT-EGFP, and εCT-EGFP transfectants, respectively. One-way ANOVA, p < 0.0001; Tukey's test, ****p < 0.0001, NS = not significant. (H) Western blot analysis of MEFCtl. cells transfected with EGFP fusion constructs. See also Supplemental Figure S2.
FIGURE 3:
FIGURE 3:
CK1δ siRNA disrupts pericentrosomal distribution of GFP-Rab11a and ciliary localization of GFP-Rab8a. (A) Localization of GFP-Rab11a, γ-tubulin, and acetylated tubulin in hTERT-RPE cells stably expressing GFP-Rab11a. After transfection with siRNA reagents, cells were serum starved for 48 h and stained as noted. Arrows indicate centrosomal location. Bars, 5 μm. (B) Quantitative analysis of results in A. ****p < 0.0001 (Fisher's exact test). (C) Localization of GFP-Rab8a, γ-tubulin, and acetylated tubulin in hTERT-RPE cells stably expressing GFP-Rab8a. After transfection with siRNA reagents, cells were serum starved for 48 h and stained as indicated. Bars, 5 μm. (D) Quantitative analysis of results in C. N = 35, 26, and 23 cells for Luc, CK1δ, and CK1ε siRNA transfectants, respectively. One-way ANOVA, p < 0.0001; Tukey's test, ****p < 0.0001. Bars, 5 μm.
FIGURE 4:
FIGURE 4:
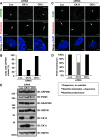
CK1δ siRNA disrupts pericentrosomal distribution of CEP290 and PCM1 in hTERT-RPE cells. (A) Intracellular distribution of CEP290. One day after transfection with the indicated siRNA reagents, cells were serum starved for 48 h before staining. Pericentrin served as a centrosomal marker. Bars, 5 μm. (B) Quantitative analysis of data in A. CEP290 cluster was defined by the presence of at least three punctae. N = 21, 47, and 20 cells for Luc, CK1δ, and CK1ε siRNA treatment groups, respectively. (C) Intracellular distribution of PCM1. Cells were processed as described in A. Bars, 5 μm. (D) Quantitative analysis of data in C. The distribution pattern was analyzed by classifying cells into three categories: pericentrosomal satellite distribution was strong (black); pericentrosomal distribution was detectable, but cytoplasmic distribution also was present (gray); cytoplasmic distribution without any pericentrosomal staining (white). N = 14, 33, and 12 cells for Luc, CK1δ, and CK1ε siRNA treatment groups, respectively. (E). Western blot analysis of endogenous CEP290, PCM1, AKAP450, and GM130 expression in hTERT-RPE cells transfected with CK1δ, CK1ε, or Luc siRNA. Cells were harvested 72 h after siRNA transfection, and equivalent amounts of cell lysates were probed with the indicated antibodies. Isoform-specific knockdown of the CK1 enzymes was confirmed. HSP70 was a loading control.
FIGURE 5:
FIGURE 5:
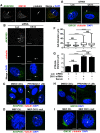
Intracellular distribution of AKAP450 and GM130 is regulated by CK1δ. (A) AKAP450 distribution in hTERT-RPE cells cultured with normal growth medium. GM130 and γ-tubulin were markers for cis-Golgi and centrosome, respectively. Arrows indicate the centrosome; bars, 5 μm (A–D). (B) AKAP450 distribution in hTERT-RPE cells treated with luciferase or CK1δ siRNA. Cells were maintained in serum-free medium and fixed 72 h after siRNA transfection. (C) AKAP450 distribution in hTERT-RPE cells treated with PF670462 or DMSO. Cells were maintained in serum-free medium with the indicated reagents for 48 h. (D) AKAP450 distribution in MEFCtl. and MEFCsnk1d null cells cultured in growth medium and stained as indicated. (E) GM130 localization in hTERT-RPE cells treated with luciferase or CK1δ siRNA. Cells were maintained in serum-free medium and fixed 72 h after siRNA transfection. Arrows indicate the centrosome; bars, 5 μm (E, H, I). (F) Golgi diameter in cells transfected with CK1δ or luciferase siRNA in presence or absence of serum. N = 123, 110, 111, and 155 cells in treatment groups from left to right. One-way ANOVA, p < 0.0001; Tukey's test, ****p < 0.0001, NS = not significant. (G) Centrosome–Golgi distance in cells treated as described in F. N as in F. Data are presented as mean ±SEM. One-way ANOVA: p < 0.0001; Tukey's test, ****p < 0.0001, NS = not significant. (H) GM130 distribution in hTERT-RPE cells after PF670462 or dimethyl sulfoxide treatment. Cells were maintained in serum-free medium with the indicated reagents for 48 h. (I) GM130 distribution in MEFCtl. and MEFCsnk1d null cells in growth medium and stained as indicated.
FIGURE 6:
FIGURE 6:
IFT20 and polycystin-2 localization are disrupted by CK1δ siRNA and PF670462. (A) GM130 and IFT20 localization in RPE cells expressing IFT20-GFP. Cells were maintained in serum-free medium for 48 h and fixed 72 h after siRNA transfection. Bars, 5 μm (A–C). (B) GM130 and IFT20 localization in mIMCD3 cells expressing IFT20-GFP. Cells were cultured in serum-free DMEM and treated with dimethyl sulfoxide (DMSO; Ctl.) or PF670462 (1 μM) for 3 h. (C) Polycystin-2, IFT20, and γ-tubulin localization in mIMCD3 cells expressing IFT20-GFP. Cells were cultured in serum-free DMEM and treated with DMSO (Ctl.) or PF670462 (1 μM) for 3 h. (D) Quantitative analysis of polycystin-2 and γ-tubulin colocalization as indicated by Pearson's r. t test, *p < 0.05; N = 12 and 17 in DMSO and PF670462 treatment groups, respectively.
FIGURE 7:
FIGURE 7:
CK1δ siRNA inhibited MT nucleation at the Golgi. hTERT-RPE cells were transfected with the indicated siRNA reagents and 48 h later were treated with nocodazole (10 μM) for 2 h at 37°C. Nocodazole-containing medium was removed and cells were washed three times with cold DMEM and then incubated in warmed DMEM at 37°C for 3 min. Cells were fixed in cold methanol and stained for GM130, γ-tubulin, tyrosinated tubulin (indicator of newly formed MTs), and DNA. Bottom, micrographs showing tyrosinated tubulin signal in gray scale. Arrows indicate location of centrosome. Bars, 5 μm.
FIGURE 8:
FIGURE 8:
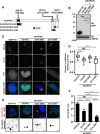
CK1δ-binding AKAP450 fragment inhibited IFT20 Golgi distribution, Golgi-derived MT nucleation and ciliogenesis. (A) Schematic diagram of GFP-labeled AKAP450 fragments. (B) Western blot analysis of AKAP450 fragments and EGFP expressed in MEFCtl. cells. HSP70 was a loading control. (C) GM130 and IFT20 localization in MEFCtl. cells expressing AKAP450 fragments or EGFP. Bars, 5 μm. (D) Quantitative analysis of GM130 and IFT20 colocalization illustrated in C. N = 11, 18, 15, and 15 for treatment groups from left to right. One-way ANOVA, p < 0.001; Tukey's test, *p < 0.05, ***p < 0.001, NS = not significant. (E) Golgi-derived MT nucleation in MEFCtl. cells transfected with GFP-labeled AKAP450 fragments. At 48 h after DNA transfection, MEFCtl. cells were incubated with nocodazole (10 μM) for 2 h and then washed and processed as described in the legend to Figure 7. Representative micrographs show cells fixed after 5 min of recovery. Bars, 5 μm. (F) Ciliary length in MEFCtl. cells transfected with GFP-labeled AKAP450 fragments. At 48 h after DNA transfection, cells were fixed and processed as described in Materials and Methods. N = 49, 50, 52, and 52 cells for treatment groups from left to right. One-way ANOVA, p < 0.0001; Tukey's test, *p < 0.05, **p < 0.01, ***p < 0.001, ****p < 0.0001, NS = not significant. See also Supplemental Figure S7.

References

    1. Behrend L, Stoter M, Kurth M, Rutter G, Heukeshoven J, Deppert W, Knippschild U. Interaction of casein kinase 1 delta (CK1delta) with post-Golgi structures, microtubules and the spindle apparatus. Eur J Cell Biol. 2000;79:240–251. - PubMed
    1. Berbari NF, Lewis JS, Bishop GA, Askwith CC, Mykytyn K. Bardet-Biedl syndrome proteins are required for the localization of G protein-coupled receptors to primary cilia. Proc Natl Acad Sci USA. 2008;105:4242–4246. - PMC - PubMed
    1. Bischof J, Muller A, Fander M, Knippschild U, Fischer D. Neurite outgrowth of mature retinal ganglion cells and PC12 cells requires activity of CK1delta and CK1epsilon. PLoS One. 2011;6:e20857. - PMC - PubMed
    1. Cheong JK, Virshup DM. Casein kinase 1: complexity in the family. Int J Biochem Cell Biol. 2011;43:465–469. - PubMed
    1. Coppieters F, Lefever S, Leroy BP, De Baere E. CEP290, a gene with many faces: mutation overview and presentation of CEP290base. Hum Mutat. 2010;31:1097–1108. - PubMed

Publication types

MeSH terms