Ras-induced epigenetic inactivation of the RRAD (Ras-related associated with diabetes) gene promotes glucose uptake in a human ovarian cancer model
- PMID: 24648519
- PMCID: PMC4022888
- DOI: 10.1074/jbc.M113.527671
Ras-induced epigenetic inactivation of the RRAD (Ras-related associated with diabetes) gene promotes glucose uptake in a human ovarian cancer model
Abstract
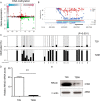
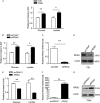
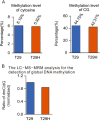
RRAD (Ras-related associated with diabetes) is a small Ras-related GTPase that is frequently inactivated by DNA methylation of the CpG island in its promoter region in cancer tissues. However, the role of the methylation-induced RRAD inactivation in tumorigenesis remains unclear. In this study, the Ras-regulated transcriptome and epigenome were profiled by comparing T29H (a Ras(V12)-transformed human ovarian epithelial cell line) with T29 (an immortalized but non-transformed cell line) through reduced representation bisulfite sequencing and digital gene expression. We found that Ras(V12)-mediated oncogenic transformation was accompanied by RRAD promoter hypermethylation and a concomitant loss of RRAD expression. In addition, we found that the RRAD promoter was hypermethylated, and its transcription was reduced in ovarian cancer versus normal ovarian tissues. Treatment with the DNA methyltransferase inhibitor 5-aza-2'-deoxycytidine resulted in demethylation in the RRAD promoter and restored RRAD expression in T29H cells. Additionally, treatment with farnesyltransferase inhibitor FTI277 resulted in restored RRAD expression and inhibited DNA methytransferase expression and activity in T29H cells. By employing knockdown and overexpression techniques in T29 and T29H, respectively, we found that RRAD inhibited glucose uptake and lactate production by repressing the expression of glucose transporters. Finally, RRAD overexpression in T29H cells inhibited tumor formation in nude mice, suggesting that RRAD is a tumor suppressor gene. Our results indicate that Ras(V12)-mediated oncogenic transformation induces RRAD epigenetic inactivation, which in turn promotes glucose uptake and may contribute to ovarian cancer tumorigenesis.
Keywords: DNA Methylation; Metabolism; Oncogenic Transformation; Ovarian Cancer; RRAD; Ras; Tumor Suppressor Gene.
© 2014 by The American Society for Biochemistry and Molecular Biology, Inc.
Figures


Similar articles
-
RAS-mediated epigenetic inactivation of OPCML in oncogenic transformation of human ovarian surface epithelial cells.FASEB J. 2006 Mar;20(3):497-9. doi: 10.1096/fj.05-4586fje. Epub 2005 Dec 29. FASEB J. 2006. PMID: 16384911
-
Proteomics analysis of H-RAS-mediated oncogenic transformation in a genetically defined human ovarian cancer model.Oncogene. 2005 Sep 8;24(40):6174-84. doi: 10.1038/sj.onc.1208753. Oncogene. 2005. PMID: 15940260 Free PMC article.
-
Methylation and gene silencing of the Ras-related GTPase gene in lung and breast cancers.Ann Surg Oncol. 2007 Apr;14(4):1397-404. doi: 10.1245/s10434-006-9089-6. Epub 2006 Dec 29. Ann Surg Oncol. 2007. PMID: 17195088
-
Epigenetic regulation of ARHI in breast and ovarian cancer cells.Ann N Y Acad Sci. 2003 Mar;983:268-77. doi: 10.1111/j.1749-6632.2003.tb05981.x. Ann N Y Acad Sci. 2003. PMID: 12724231 Review.
-
Gene methylation in gastric cancer.Clin Chim Acta. 2013 Sep 23;424:53-65. doi: 10.1016/j.cca.2013.05.002. Epub 2013 May 10. Clin Chim Acta. 2013. PMID: 23669186 Review.
Cited by
-
A new approach to decode DNA methylome and genomic variants simultaneously from double strand bisulfite sequencing.Brief Bioinform. 2021 Nov 5;22(6):bbab201. doi: 10.1093/bib/bbab201. Brief Bioinform. 2021. PMID: 34058751 Free PMC article.
-
The Fra-1-miR-134-SDS22 feedback loop amplifies ERK/JNK signaling and reduces chemosensitivity in ovarian cancer cells.Cell Death Dis. 2016 Sep 29;7(9):e2384. doi: 10.1038/cddis.2016.289. Cell Death Dis. 2016. PMID: 27685628 Free PMC article.
-
Bacteriocyte Reprogramming to Cope With Nutritional Stress in a Phloem Sap Feeding Hemipteran, the Pea Aphid Acyrthosiphon pisum.Front Physiol. 2018 Oct 25;9:1498. doi: 10.3389/fphys.2018.01498. eCollection 2018. Front Physiol. 2018. PMID: 30410449 Free PMC article.
-
Transcriptomic analysis reveals crucial regulatory roles of immediate-early response genes and related signaling pathways in coronavirus infectious bronchitis virus infection.Virology. 2022 Oct;575:1-9. doi: 10.1016/j.virol.2022.08.001. Epub 2022 Aug 14. Virology. 2022. PMID: 35987078 Free PMC article.
-
Ras-related associated with diabetes genes for biomarker-based therapeutics in cancer: A comparative evolutionary genomic study.Saudi Med J. 2024 Feb;45(2):111-120. doi: 10.15537/smj.2024.45.2.20230564. Saudi Med J. 2024. PMID: 38309727 Free PMC article.
References
Publication types
MeSH terms
Substances
LinkOut - more resources
Full Text Sources
Other Literature Sources
Medical
Molecular Biology Databases
Research Materials
Miscellaneous

