. 2014 Mar 21:13:64.
doi: 10.1186/1476-4598-13-64.

IRF-1 regulates alternative mRNA splicing of carcinoembryonic antigen-related cell adhesion molecule 1 (CEACAM1) in breast epithelial cells generating an immunoreceptor tyrosine-based inhibition motif (ITIM) containing isoform

Affiliations

IRF-1 regulates alternative mRNA splicing of carcinoembryonic antigen-related cell adhesion molecule 1 (CEACAM1) in breast epithelial cells generating an immunoreceptor tyrosine-based inhibition motif (ITIM) containing isoform

Kenneth J Dery et al. Mol Cancer. .

Abstract

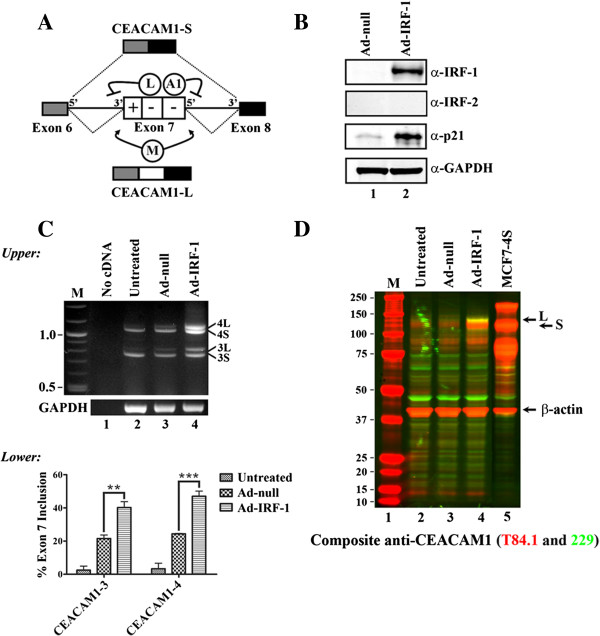
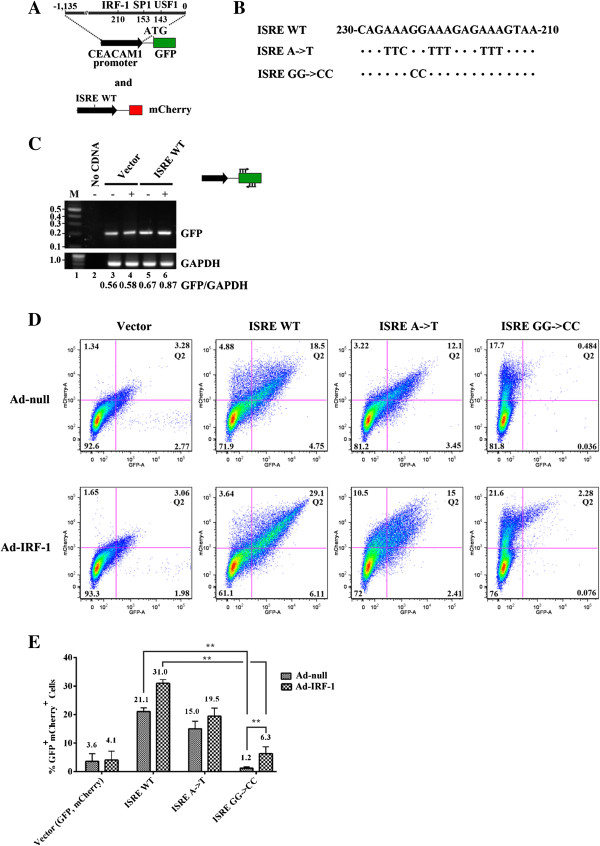
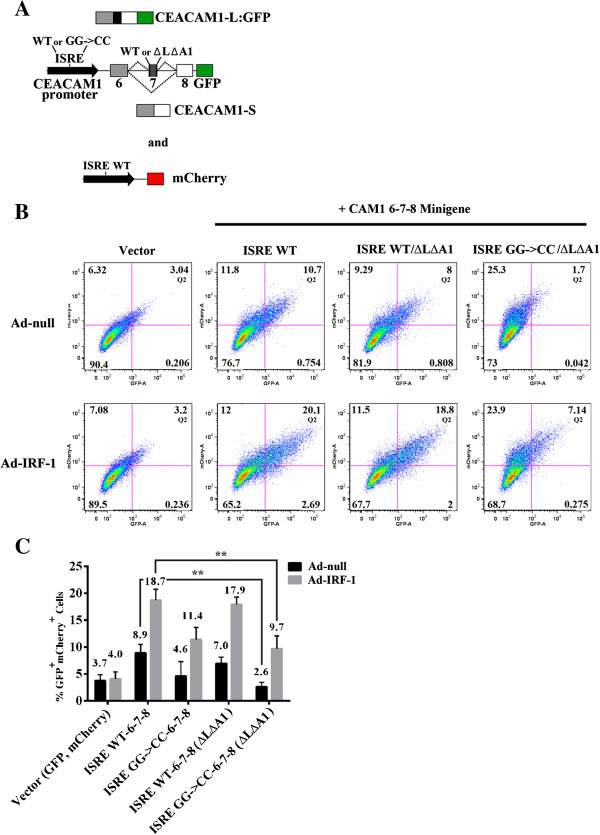
Background: Interferon regulatory factor-1 (IRF-1) is a master regulator of IFN-γ induced gene transcription. Previously we have shown that IRF-1 transcriptionally induces CEACAM1 via an ISRE (Interferon-Stimulated Response Element) in its promoter. CEACAM1 pre-mRNA undergoes extensive alternative splicing (AS) generating isoforms to produce either a short (S) cytoplasmic domain expressed primarily in epithelial cells or as an ITIM-containing long (L) isoform in immune cells.

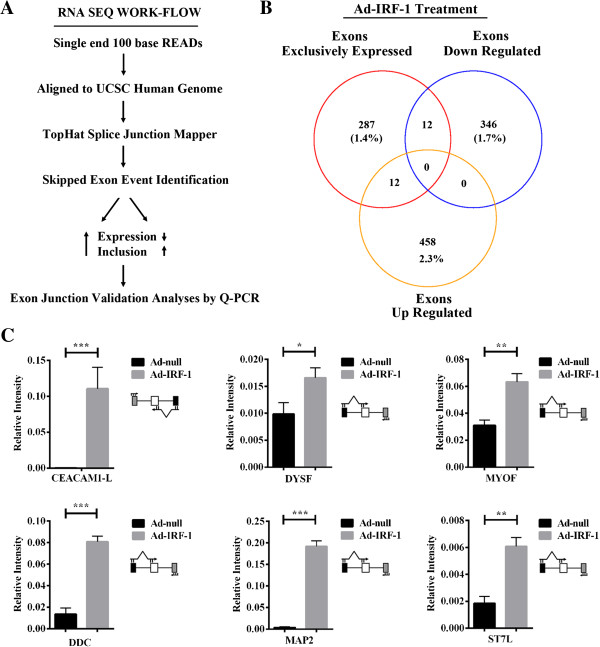
Methods: The transcriptional and molecular mechanism of CEACAM1 minigenes AS containing promoter ISREs mutations in the breast epithelial, MDA-MB-468, cell line was detected using flow cytometry. In addition, transcriptome sequencing was utilized to determine whether IRF-1 could direct the AS of other genes as well. Tumor xenografts were used to evaluate CEACAM1 isoform expression on the leading edge of breast tumor cells.

Results: In the present study, we provide evidence that CEACAM1's promoter and variable exon 7 cross-talk allowing IRF-1 to direct AS events. Transcriptome sequencing shows that IRF-1 can also induce the global AS of genes involved in regulation of growth and differentiation as well as genes of the cytokine family. Furthermore, MDA-MB-468 cells grown as tumor xenografts exhibit an AS switch to the L-isoform of CEACAM1, demonstrating that an in vivo inflammatory milieu is also capable of generating the AS switch, similar to that found in human breast cancers Mol Cancer 7:46, 2008.

Conclusions: The novel AS regulatory activities attributed to IRF-1 indicate that the IFN-γ response involves a global change in both gene transcription and AS in breast epithelial cells.


Figures

Figure 1
Figure 1
Forced expression by Ad-IRF-1 generates CEACAM1-L isoform in MDA-MB-468 breast carcinoma cells. (A) Model of cis and trans-acting elements involved in CEACAM1 AS. A general splicing mechanism involves physical interaction of hnRNP L and hnRNP A1 (enclosed in circles) with exon 7 (indicated by white box) at ESSs (indicated by – sign) to generate CEACAM1-S through repression of 3’ and 5’ ss (inhibitory arrows). hnRNP M promotes formation of CEACAM1-L through exon definition (arrows) as part of the regulatory splicing complex that participates with the Exon Splicing Enhancer (ESE; + sign). (B) Total cellular protein lysates from viral vector treated (Ad-null) or Ad-IRF-1 treated cells were subjected to Western blot and probed with antibodies to IRF-1, IRF-2, and p21. GAPDH was used as a loading control. (C) Induction of isoform CEACAM1-3L and CEACAM1-4L mRNA by Ad-IRF-1 after 24 h. (Upper) Total RNAs were isolated, subjected to RT-PCR and separated by electrophoresis on a 2.25% agarose gel. The position of CEACAM1-3 and CEACAM1-4 splice variants are indicated on right. M refers to a 100-bp DNA ladder (New England Biolabs). (Lower) Histogram quantification of data is n =3 independent experiments. The mean ± S.E. shown for percent exon 7 inclusion was calculated as the % [CEACAM1-L/(CEACAM1-L + CEACAM1-S)] mRNA. **, p < 0.01; ***, p < 0.001 versus Ad-null control. (D) Western blotting of cell lysates after induction of Ad-IRF-1 after 24 h with antibody T84.1 (red channel) which recognizes both isoforms of CEACAM1 (-S and –L) and antibody 229 (green channel) which recognizes CEACAM1-L isoform exclusively (each individually found in Additional file 3: Figure S3A-B). Shown is a composite of superimposed antibodies to highlight production of CEACAM1-L (yellow combined channels) after Ad-IRF-1 treatment.
Figure 2
Figure 2
ISRE GG->CC mutant impairs GFP expression in CEACAM1 promoter-driven constructs. (A) Schematic diagram of the -1,135-kb fragment, in relation to the ATG start codon, of the CEACAM1 promoter (upper black arrow) fused in translational reading frame to GFP (green box). Known transcription factor binding sites to IRF-1, SP1 and USF-1 are indicated. A mCherry reporter that was co-transfected and used as a quantitation control was fused to CEACAM1 WT ISRE (lower black arrow). (B) Nucleotide comparisons of the 21-bp ISRE with mutant alleles (A->T and GG->CC). (C) RT-PCR of GFP gene expression. Total RNAs were isolated, subjected to semi-quantitative PCR and separated by electrophoresis on a 1% agarose gel. GFP and GAPDH are indicated to the right and primer positions for ISRE promoter-driven GFP are indicated in the schematic. (D) Flow cytometric analyses of CEACAM1 ISRE WT and mutant promoter alleles GFP reporter constructs after Ad-null or Ad-IRF-1 treatment showing mCherry (Y-axis) and GFP (X-axis). Results are from one of three experiments with similar results. (E) Histogram of Quadrant 2 (Q2) in Figure 2D shows % cells expressing vector, ISRE WT, or mutant ISREs in GFP and ISRE WT mCherry reporter activity (% GFP+ mCherry+ cells). Results are from n = 3 independent experiments and **, p < 0.01 versus ISRE WT controls are indicated.
Figure 3
Figure 3
GG->CC mutation in the CEACAM1 ISRE impairs IRF-1 and IRF-2 Binding. (A) CEACAM1 ISRE (underline) containing 60-mer oligonucleotides are shown with enlarged nt (GG) in the WT or (CC) in the mutant. EBNA DNA served as the positive control for binding. (B-D) Fluorescent electrophoretic mobility shifts (fEMSA) were performed with 0.3 pmol IRDye-labeled oligonucleotides (EBNA-700 nm, ISRE GG->CC-800 nm and ISRE WT-700 nm) and increasing moles of IRF-1 (B) or IRF-2 (C) as shown. Epstein-Barr Nuclear Antigen extract is used to form a positive control complex denoted by EBNA complex (left). DNA-protein complexes produced by incubation with specific IRF proteins produce either a slow-migrating (C1) or faster-migrating complex (C2). (D) Competition assays were performed by adding increasing amounts of ISRE-WT DNA (red channel) in the presence of 0.3 pmol ISRE GG->CC DNA (green channel) and either 67 pmol IRF-1 or IRF-2 protein. Addition of competitor DNA to produce all three binding states (unbound, yellow C2 and C1 complexes) indicates complete saturation of exogenous IRF protein. Results are from one of three experiments with similar results.
Figure 4
Figure 4
Mutations in CEACAM1 promoter fail to ablate GFP expression when fused to CEACAM1 6-7-8 minigene. (A) Schematic diagram of CEACAM1’s WT promoter and mutants A- > T and GG->CC (upper black arrow) were translationally fused to exons 6-7-8 minigene. Only AS to generate the L-isoform expresses the GFP reporter. A mCherry reporter that was co-transfected and used as a quantitation control was fused to CEACAM1 WT ISRE (lower black arrow). (B-C) Flow cytometric analyses, histogram and statistical analyses of Q2 in Figure 4B were similar to description in Figure 2 legend.
Figure 5
Figure 5
Ad-IRF-1 is necessary and responsible for inducing AS in CEACAM1 to generate the L-isoform. (A) Schematic diagram of CEACAM1’s promoter (WT; upper black arrow) and mutant GG- > CC translationally fused to exons 6-7-8 minigene. Only AS to generate the L-isoform expresses the GFP reporter. Mutations that ablate the hnRNP L and hnRNP A1 binding sites on exon 7 (black box) are indicated (ΔLΔA1). A mCherry reporter that was co-transfected and used as a quantitation control was fused to CEACAM1 WT ISRE (lower black arrow). (B-C) Flow cytometric analyses, histogram and statistical analyses of Q2 in Figure 5B were similar to description in Figure 2 legend.
Figure 6
Figure 6
RNP complexes containing hnRNP L, A1, and M associate with CEACAM1 mRNA. (A-B) Quantitative RT-PCR of immunoprecipitated CEACAM1-L and CEACAM1-S mRNA. Primers were designed to either detect the presence or absence of exon 7, as shown above each figure. The average CEACAM1 mRNA fold enrichment is shown above each antibody (histogram) tested. (C) Model for the role of IRF-1 in coupling transcription and AS. In breast carcinoma epithelial cells default splicing maintains production of CEACAM1-S. When IRF-1 binds to its cognate ISRE sequence, the transcriptional complex communicates with the splicing machinery (denoted with <->) via uncharacterized interactions through splicing regulators leading to an AS switch and production of CEACAM1-L.
Figure 7
Figure 7
RNA SEQ of Ad-IRF-1 treated breast carcinoma cells, MDA-MB-468. (A) RNA SEQ Workflow. Reads were analyzed for exclusion, inclusion and differential gene expression in -/+ induction by Ad-IRF-1 after 24 h. Only genes with high inclusion but low expression reads were considered candidates for further study and validated by exon junction specific PCR. (B) A Venn diagram summarizing the overlap between genes differentially expressed. Exons exclusively expressed (representing exon inclusion; red circle), exons dowregulated (yellow circle) are shown in this array. (C) Quantitative RT-PCR of candidates as compared to control sample CEACAM1. Primer pairs were designed as exon junction to recognize upstream and variable exon with priming on the downstream exon as shown above the figure.
Figure 8
Figure 8
IRF-1 can induce global splicing changes in the interleukin family of genes. (A) Array of cytokine-network IFN-associated genes and endogenous control genes are indicated. (B) Interleukin-associated genes. Total RNAs from MDA-MB-468 cells were isolated, converted to cDNA and subjected to qRT-PCR. Data are expressed as ratio of cytokine gene expression to endogenous control gene signal intensities after culturing for 24 h. All assays are plated in triplicate. *, p < 0.05, **, p < 0.01; ***, p < 0.001 versus Ad-null control.
Figure 9
Figure 9
Expression pattern of cytoplasmic isoforms of CEACAM1 in vivo. (A) Mean MDA-MB-468 tumor volumes (±SD) orthotopically implanted into mammary fat pads of NOD/SCID mice (n = 6). (B) Total RNAs were isolated from 6 tumors and two parental cell populations. RNAs were subjected to quantitative PCR using exon-junction specific primers. The % exon 7 inclusion was calculated by taking the CEACAM1-L/S ratio in tumor cells and comparing this fold increase to the CEACAM1-L/S ratio in parental cells. (C) Immunofluorescence staining of human CEACAM1 expressing cells from MDA-MB-468 tumor tissue. (Upper): Expression of CEACAM1-L but not CEACAM1-S is more intense at the invasive front of the breast carcinoma tissue. Immunofluorescence staining of human CEACAM1 expressing cells from MDA-MB-468 tumor tissue using antibodies directed to the ectodomain shown in red (5F4 mouse antibody 1:200; shown with white arrowheads) or the -L cytoplasmic tail of CEACAM1 shown in green (229 rabbit antibody 1:200; shown with white arrow) followed by secondary antibodies (goat anti-rabbit, Alexa Fluor 488 labeled and goat anti-mouse, Alexa Fluor 555 labeled; 1:200). For nuclei staining, Hoechst 33342 (blue) was used at final concentration of 1 μg/ml. Scale bar, 100 μm. (Lower): Secondary antibodies only were used as negative controls to rule out interference from auto-fluorescence.

Similar articles

Cited by

References

    1. Bonjardim CA. Interferons (IFNs) are key cytokines in both innate and adaptive antiviral immune responses–and viruses counteract IFN action. Microbes Infect. 2005;7:569–578. doi: 10.1016/j.micinf.2005.02.001. - DOI - PubMed
    1. Li J, Yu B, Song L, Eschrich S, Haura EB. Effects of IFN-gamma and Stat1 on gene expression, growth, and survival in non-small cell lung cancer cells. J Interferon Cytokine Res. 2007;27:209–220. doi: 10.1089/jir.2006.0111. - DOI - PubMed
    1. Schoenborn JR, Wilson CB. Regulation of interferon-gamma during innate and adaptive immune responses. Adv Immunol. 2007;96:41–101. - PubMed
    1. Savitsky D, Tamura T, Yanai H, Taniguchi T. Regulation of immunity and oncogenesis by the IRF transcription factor family. Cancer Immunol Immunother. 2010;59:489–510. doi: 10.1007/s00262-009-0804-6. - DOI - PMC - PubMed
    1. Escalante CR, Yie J, Thanos D, Aggarwal AK. Structure of IRF-1 with bound DNA reveals determinants of interferon regulation. Nature. 1998;391:103–106. doi: 10.1038/34224. - DOI - PubMed

MeSH terms