

Polyion selective polymeric membrane-based pulstrode as a detector in flow-injection analysis
- PMID: 24650129
- PMCID: PMC4004189
- DOI: 10.1021/ac500567g
Polyion selective polymeric membrane-based pulstrode as a detector in flow-injection analysis
Abstract
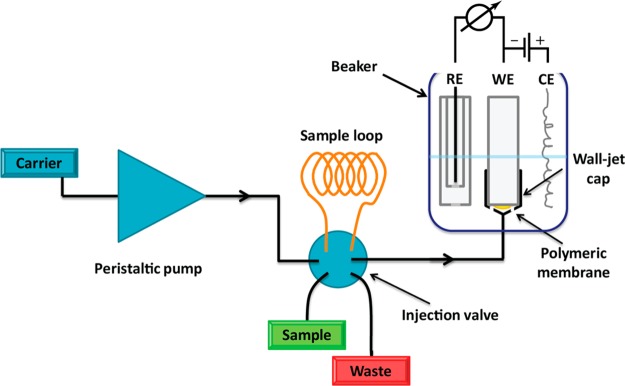
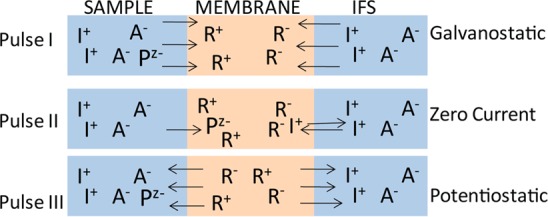
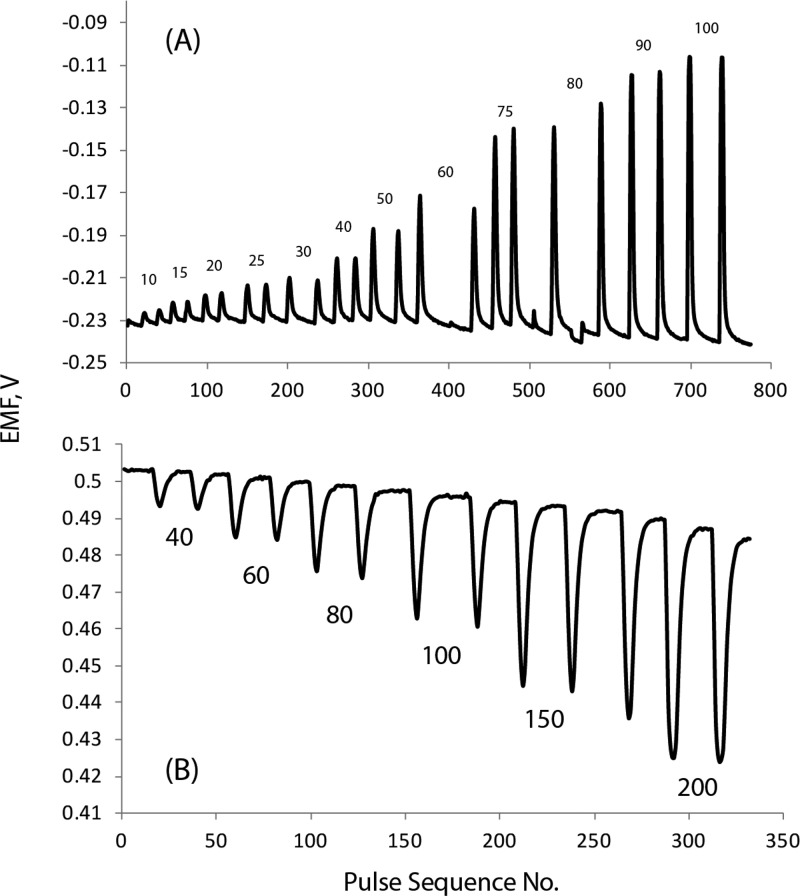
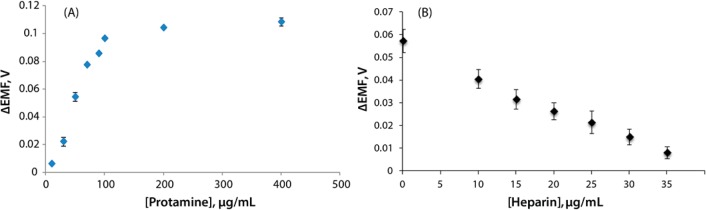
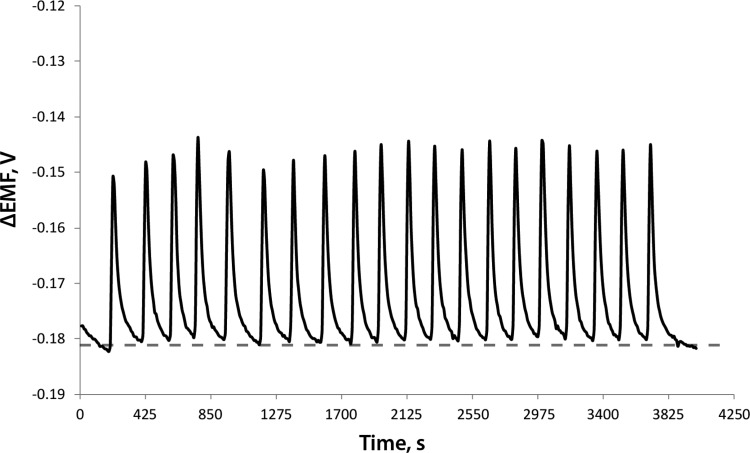
A method for the detection of polyions using fully reversible polyion selective polymeric membrane type pulstrodes as detectors in a flow-injection analysis (FIA) system is examined. The detection electrode consists of a plasticized polymeric membrane doped with 10 wt % of tridodecylmethylammonium-dinonylnaphthalene sulfonate (TDMA/DNNS) ion-exchanger salt. The pulse sequence used involves a short (1 s) galvanostatic pulse, an open-circuit pulse (0.5 s) during which the EMF of the cell is measured, and a longer (15 s) potentiostatic pulse to return the membrane to its original chemical composition. It is shown that total pulse sequence times can be optimized to yield reproducible real-time detection of injected samples of protamine and heparin at up to 20 samples/h. Further, it is shown that the same membrane detector can be employed for FIA detection of both polycations at levels ≥10 μg/mL and polyanions at levels of ≥40 μg/mL by changing the direction of the galvanostatic pulse. The methodology described may also be applicable in the detection of polyionic species at low levels in other flowing configurations, such as in liquid chromatography and capillary electrophoresis.
Figures
Similar articles
-
Reversible detection of heparin and other polyanions by pulsed chronopotentiometric polymer membrane electrode.Anal Chem. 2010 Mar 1;82(5):1612-5. doi: 10.1021/ac902836e. Anal Chem. 2010. PMID: 20121058 Free PMC article.
-
Manual and Flow-Injection Detection/Quantification of Polyquaterniums via Fully Reversible Polyion-Sensitive Polymeric Membrane-Based Ion-Selective Electrodes.ACS Sens. 2017 Oct 27;2(10):1505-1511. doi: 10.1021/acssensors.7b00527. Epub 2017 Sep 18. ACS Sens. 2017. PMID: 28862444
-
Flash chronopotentiometric sensing of the polyions protamine and heparin at ion-selective membranes.Anal Biochem. 2009 Mar 15;386(2):276-81. doi: 10.1016/j.ab.2008.12.023. Epub 2008 Dec 25. Anal Biochem. 2009. PMID: 19154727
-
Rotating electrode potentiometry: lowering the detection limits of nonequilibrium polyion-sensitive membrane electrodes.Anal Chem. 2001 Jan 15;73(2):332-6. doi: 10.1021/ac000756g. Anal Chem. 2001. PMID: 11199986
-
Electrochemical heparin sensing at liquid/liquid interfaces and polymeric membranes.Anal Bioanal Chem. 2011 Jan;399(2):571-9. doi: 10.1007/s00216-010-4056-2. Epub 2010 Aug 5. Anal Bioanal Chem. 2011. PMID: 20686753 Review.
References
-
- Ma S.; Meyerhoff M. E.; Yang V. C. Anal. Chem. 1992, 64, 694–697. - PubMed
-
- Ma S.; Yang V. C.; Fu B.; Meyerhoff M. E. Anal. Chem. 1993, 65, 2078–2084. - PubMed
-
- Fu B.; Bakker E.; Yun J. H.; Yang V. C.; Meyerhoff M. E. Anal. Chem. 1994, 66, 2250–2259. - PubMed
-
- Fu B.; Bakker E.; Yang V. C.; Meyerhoff M. E. Macromolecules 1995, 28, 5834–5840.
-
- Ye Q.; Meyerhoff M. E. Anal. Chem. 2001, 73, 332–336. - PubMed
Publication types
MeSH terms
Substances
Grants and funding
LinkOut - more resources
Full Text Sources
Other Literature Sources
