. 2014 Mar 21:15:79.
doi: 10.1186/1471-2105-15-79.

The characteristic direction: a geometrical approach to identify differentially expressed genes

Affiliations

The characteristic direction: a geometrical approach to identify differentially expressed genes

Neil R Clark et al. BMC Bioinformatics. .

Abstract

Background: Identifying differentially expressed genes (DEG) is a fundamental step in studies that perform genome wide expression profiling. Typically, DEG are identified by univariate approaches such as Significance Analysis of Microarrays (SAM) or Linear Models for Microarray Data (LIMMA) for processing cDNA microarrays, and differential gene expression analysis based on the negative binomial distribution (DESeq) or Empirical analysis of Digital Gene Expression data in R (edgeR) for RNA-seq profiling.

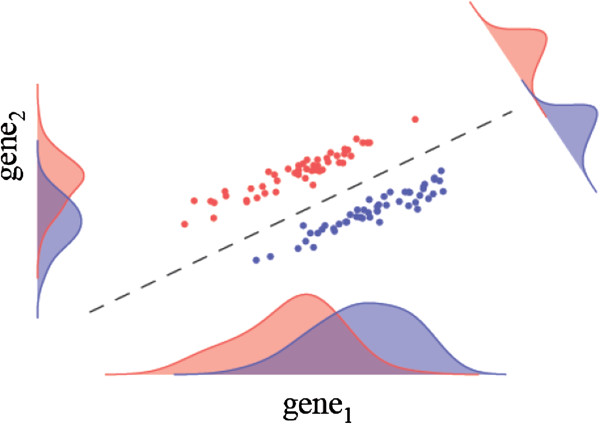
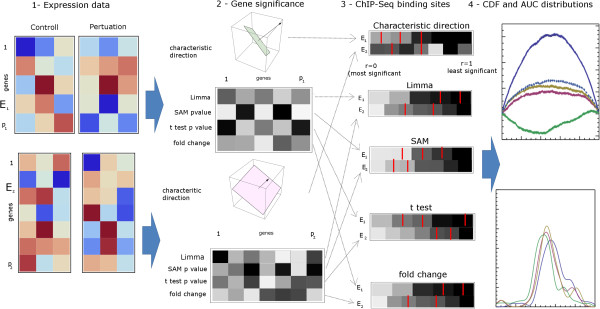
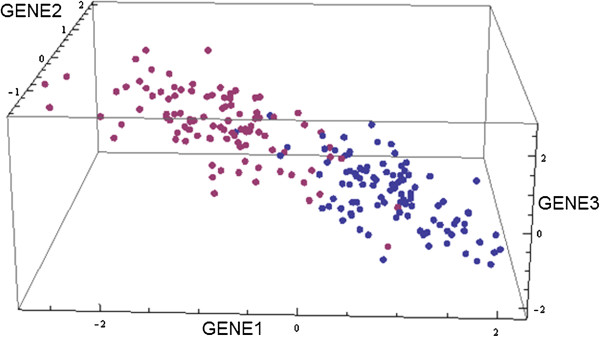
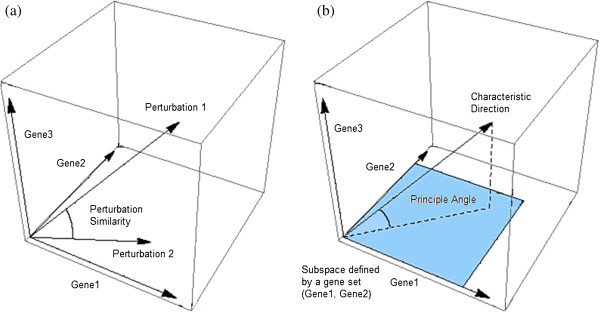
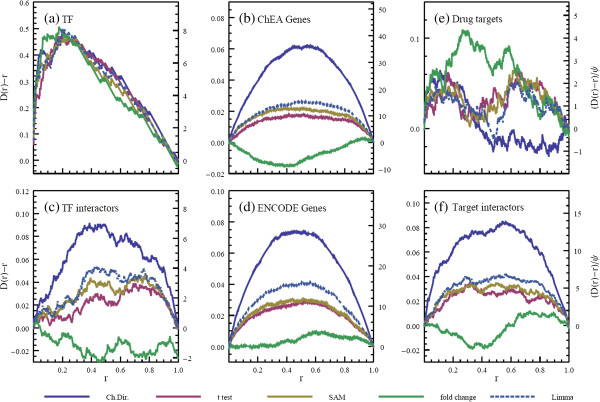
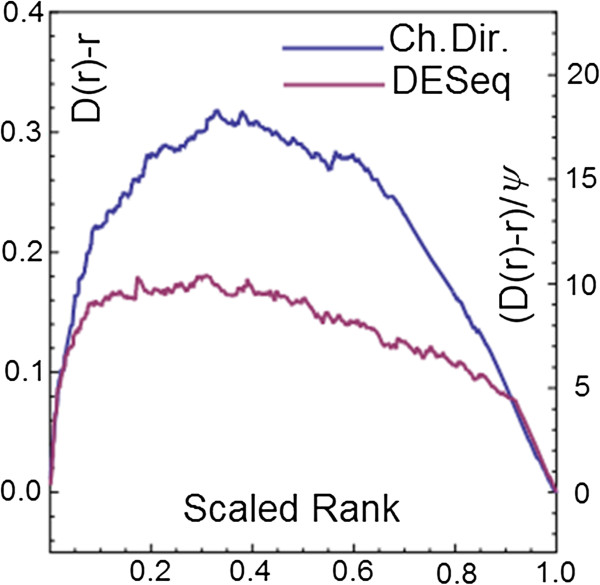
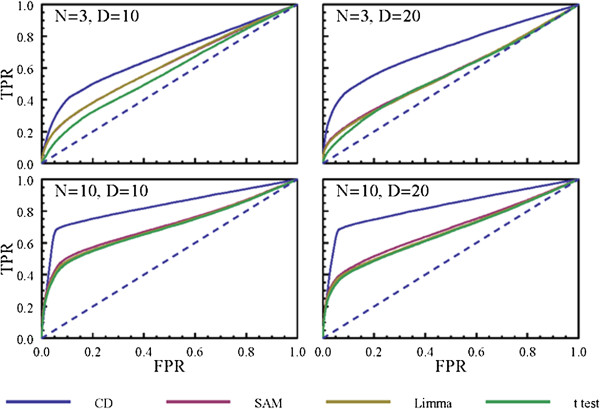
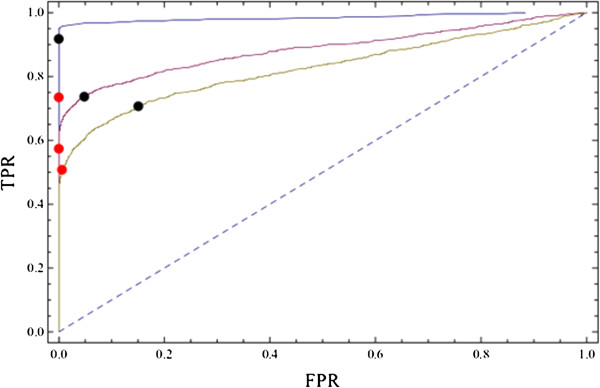
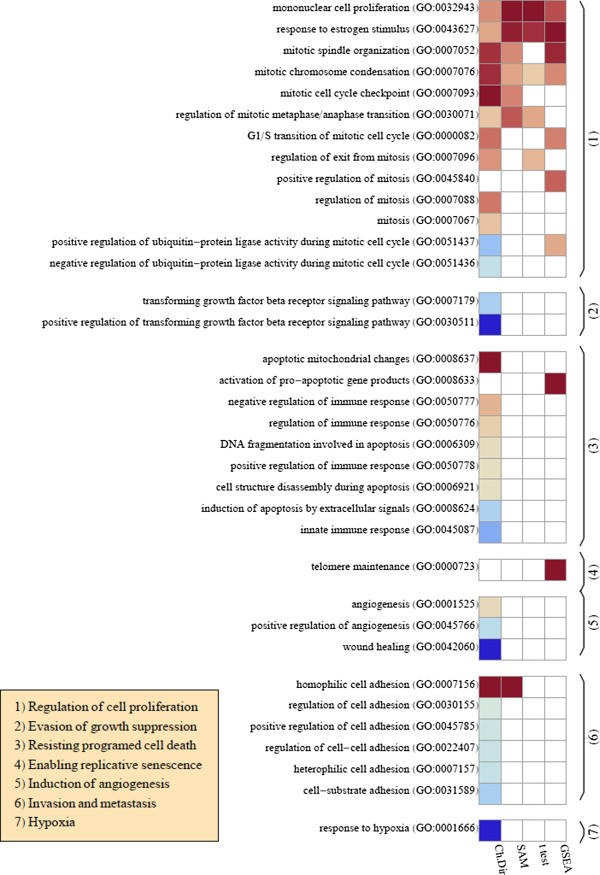
Results: Here we present a new geometrical multivariate approach to identify DEG called the Characteristic Direction. We demonstrate that the Characteristic Direction method is significantly more sensitive than existing methods for identifying DEG in the context of transcription factor (TF) and drug perturbation responses over a large number of microarray experiments. We also benchmarked the Characteristic Direction method using synthetic data, as well as RNA-Seq data. A large collection of microarray expression data from TF perturbations (73 experiments) and drug perturbations (130 experiments) extracted from the Gene Expression Omnibus (GEO), as well as an RNA-Seq study that profiled genome-wide gene expression and STAT3 DNA binding in two subtypes of diffuse large B-cell Lymphoma, were used for benchmarking the method using real data. ChIP-Seq data identifying DNA binding sites of the perturbed TFs, as well as known drug targets of the perturbing drugs, were used as prior knowledge silver-standard for validation. In all cases the Characteristic Direction DEG calling method outperformed other methods. We find that when drugs are applied to cells in various contexts, the proteins that interact with the drug-targets are differentially expressed and more of the corresponding genes are discovered by the Characteristic Direction method. In addition, we show that the Characteristic Direction conceptualization can be used to perform improved gene set enrichment analyses when compared with the gene-set enrichment analysis (GSEA) and the hypergeometric test.

Conclusions: The application of the Characteristic Direction method may shed new light on relevant biological mechanisms that would have remained undiscovered by the current state-of-the-art DEG methods. The method is freely accessible via various open source code implementations using four popular programming languages: R, Python, MATLAB and Mathematica, all available at: http://www.maayanlab.net/CD.


Figures

Figure 1
Figure 1
Illustration of a case where there is no marginal differential expression of individual genes, however in the multivariate setting the differential expression becomes clear. Projecting the data onto the appropriate direction in this case leads to a clear separation between the classes.
Figure 2
Figure 2
Schematic of the validation pipeline: 1) Expression data from a large number of experiments with control vs. perturbation samples; 2) The various approaches to differential expression are used to rank genes in order of significance; 3) Prior knowledge gene lists, for example genes associated with ChIP-Seq binding sites of the perturbed TF, are identified in the ranked list and the cumulative distribution is calculated; 4) The perturbation of the cumulative distribution from uniform is examined. Large deviations from zero, on the scale of φ, indicate significant prioritization of the prior knowledge genes. Also, the AUC distributions are examined across the various methods.
Figure 3
Figure 3
Illustration of the structure of the synthetic data with parameters: p = 3, nd= 2, D = 2, N = 3, and Δ = 3.0. The differentially expressed genes are gene1 and gene3. The two different colors of points indicate the two classes of samples: “control” and “perturbed”.
Figure 4
Figure 4
Illustration of gene set enrichment with the characteristic direction concept. a) Similarity between two perturbations can be interpreted as the angle subtended between two characteristic directions. b) Gene set enrichment analysis can be formulated as the principal angle between the characteristic direction and the subspace spanned by the genes in a gene set.
Figure 5
Figure 5
Comparison of the distributions of the scaled rankings of the gene sets for the various methods for the TF (a-d) and drug (e-f) perturbations. Each sub-plot shows the deviation of the cumulative distribution from uniform of the rankings of each gene set and analysis method, (a) the TF perturbed by each experiment; b) genes associated with binding sites of the TF as measured in ChIP-Seq experiments from ChEA; c) the genes interacting with the TF or the gene that encodes the TF; d) genes associated with binding sites of the TF as measured in ChIP-Seq experiments from ENCODE; The perturbation of the cumulative distribution of the rankings of (e) drug targets, and (f) genes that their protein product are known to interact with the drug targets.
Figure 6
Figure 6
Distribution of the top 500 genes associated with differential STAT3 binding in the ranked list of differentially expressed genes as determined by DESeq or the characteristic direction.
Figure 7
Figure 7
ROC curves comparing the various DEG ranking methods for the ability to identify DEG from synthetic data created by the following parameters: p = 10 4 , n d = 2 × 10 3 , and ∆=0.3; the remaining parameters are as indicated in the figure panels.
Figure 8
Figure 8
Deciding where to place the cutoff using synthetic data. a) Sorted squared characteristic direction components for the various synthetic datasets. Dashed lines indicate the top 500, 1000, and 2000 genes. b) The null ranked squared coefficient distribution for the synthetic datasets. c) The ratio of the ranked squared coefficient distribution for the synthetic datasets to the null distribution assuming no difference between the classes. Dashed lines indicate the top 500, 1000, and 2000 genes. d) The cumulative distribution of the ratio between the squared coefficient distribution and the null distribution. The variable, s, which is indicated with an arrow, measures the distance perpendicular to the diagonal. e) The value of s for each of the synthetic datasets. The dashed lines indicate the top 500, 1000, and 2000 genes.
Figure 9
Figure 9
ROC curves for the synthetic datasets with points indicating the FPR and TPR values at the various thresholds. Red points show the values for the more conservative threshold value of b^2=b_null^2 and the black points indicate the values correspond to the peak of the curves in Figure 8.
Figure 10
Figure 10
Comparison of hallmark GO biological processes identified as significant in the differential expression of tumorigenic verses normal samples by enrichment of the significant genes called by various the methods. Results of GSEA [15,30] analysis are included for comparison. Colored boxes indicate that the GO category is identified as significant with an FDR of 10% (60% for GSEA), and deeper red colors have a smaller mean rank of the gene set, corresponding to more up-regulation of the set, while deeper blue colors have a larger mean rank, corresponding to more down-regulation of the set. The GO categories are sub-categorized corresponding to the six hallmark characteristics of cancer as indicated in the inset box. The seventh category is included to evaluate the significance of the hypoxia GO category.

References

    1. Allison DB, Cui X, Page GP, Sabripour M. Microarray data analysis: from disarray to consolidation and consensus. Nat Rev Genet. 2006;7(1):55–65. doi: 10.1038/nrg1749. - DOI - PubMed
    1. Budhraja V, Spitznagel E, Schaiff WT, Sadovsky Y. Incorporation of gene-specific variability improves expression analysis using high-density DNA microarrays. BMC Biol. 2003;1(1):1. doi: 10.1186/1741-7007-1-1. - DOI - PMC - PubMed
    1. Hsiao A, Worrall D, Olefsky J, Subramaniam S. Variance-modeled posterior inference of microarray data: detecting gene-expression changes in 3T3-L1 adipocytes. Bioinformatics. 2004;20(17):3108–3127. doi: 10.1093/bioinformatics/bth371. - DOI - PubMed
    1. Miller RA, Galecki A, Shmookler-Reis RJ. Interpretation, design, and analysis of gene array expression experiments. J Gerontol A Biol Sci Med Sci. 2001;56(2):B52–B57. doi: 10.1093/gerona/56.2.B52. - DOI - PubMed
    1. Tusher VG, Tibshirani R, Chu G. Significance analysis of microarrays applied to the ionizing radiation response. Proc Natl Acad Sci. 2001;98(9):5116–5121. doi: 10.1073/pnas.091062498. - DOI - PMC - PubMed

Publication types