. 2014 Mar 21;16(2):R76.
doi: 10.1186/ar4517.

Increased expression of Mer tyrosine kinase in circulating dendritic cells and monocytes of lupus patients: correlations with plasma interferon activity and steroid therapy

Increased expression of Mer tyrosine kinase in circulating dendritic cells and monocytes of lupus patients: correlations with plasma interferon activity and steroid therapy

Brendan A Hilliard et al. Arthritis Res Ther. .

Abstract

Introduction: The requirement for the immunoregulatory Mer tyrosine kinase (Mer) for optimal removal of apoptotic cells prompted us to look at its expression in systemic lupus erythematosus (SLE), in which apoptotic cell clearance is abnormal. We compared the levels of expression of Mer in normal human subjects and in patients with SLE.

Methods: We used flow cytometry of isolated peripheral blood mononuclear cells to compare the levels of Mer on leukocyte subsets. We used a Mer-specific enzyme-linked immunosorbent assay (ELISA) to quantify soluble Mer (sMer) in plasmas.

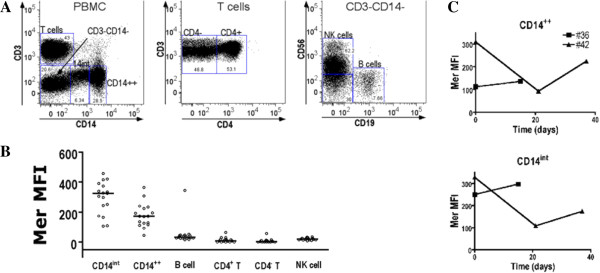
Results: Monocytes, CD1c⁺ myeloid dendritic cells (mDCs), and plasmacytoid dendritic cells (pDCs) from both normal individuals and from SLE patients expressed Mer. In both normal and SLE patients, the CD14⁺⁺CD16⁺ subpopulation of monocytes expressed the highest levels of Mer, with somewhat lower levels on the CD14(int)CD16⁺ population. Mer levels on CD1c⁺ mDCs and pDCs, and sMer levels in blood were increased in SLE patients compared with controls. In patients, Mer levels on CD14(int)CD16⁺, CD14⁺⁺CD16⁻ monocytes, and CD1c⁺ dendritic cells correlated positively with type I interferon (IFN-I) activity detected in blood. In SLE patients treated with corticosteroids, Mer expression on monocytes correlated with prednisone dose, CD1c⁺ myeloid dendritic cells in patients treated with prednisone had higher levels of Mer expression than those in patients not receiving prednisone.

Conclusions: We found no global defect in Mer expression in lupus blood. In contrast, we observed increased levels of Mer expression in DC populations, which could represent a response to increased IFN-I in SLE patients. Enhanced Mer expression induced by corticosteroids may contribute to its beneficial effects in SLE.


Figures

Figure 1
Figure 1
Flow-cytometric analysis of leukocyte subsets from the peripheral blood of normal individuals. (A) Gating strategy for identifying leukocyte subsets. (B) Mer expression on the surface of leukocyte subsets. MFI represents the mean fluorescence intensity obtained with the anti-Mer antibody. The data are from a group of normal healthy individuals (n = 14). (C) Mer expression varies over time. The expression of Mer on the CD14int population and the CD14++ monocytes was examined in two normal individuals at different time points.
Figure 2
Figure 2
Expression of Mer on monocyte subpopulations from the peripheral blood of normal individuals. (A) Gating strategy for the identification of monocyte subsets. (B) Expression of Mer on the surface of monocyte subpopulations from the peripheral blood of two representative normal individuals. (C) Mean expression of Mer on monocyte subsets of normal individuals (n = 20).
Figure 3
Figure 3
Expression of Mer on dendritic cell populations from the peripheral blood of normal individuals. (A) Gating strategy for the identification of dendritic cells subsets. (B) Expression of Mer on the surface of CD1c+ myeloid dendritic cells subpopulations from the peripheral blood of a representative normal individual. (C) Expression of Mer on the surface of pDCs on myeloid dendritic cells subpopulations from the peripheral blood of a representative normal individual. (D) Expression of Mer on dendritic subsets of normal individuals (n = 15). Horizontal bars represent mean values.
Figure 4
Figure 4
Expression of Mer in blood from normal individuals and patients with SLE. (A) Results from the first group of individuals for monocytes. Horizontal bars indicate means. (B) Results from the second group of individuals for monocytes. Horizontal bars indicate means. (C) Results from the second group for dendritic cell populations. Horizontal bars indicate medians, and * indicates statistical significance (Mann–Whitney, P < 0.05). (D) Quantification of soluble Mer in the plasma of lupus and healthy individuals. Horizontal bars represent median values. ***Statistical significance (Mann–Whitney, P < 0.001).
Figure 5
Figure 5
Expression of Mer on monocytes and myeloid dendritic cells in patients with SLE correlates with IFN-I activity. Interferon activity influences the proportion of monocytes and myeloid dendritic cells in blood. (A) IFN-I activity in plasmas from normal individuals and SLE patients. The optical density units obtained for plasma-induced alkaline phosphatase activity in plasmas are shown. Mer levels on (B) CD14intCD16+ monocyte and (C) CD14++CD16- and CD1c+ DC subsets positively correlate with IFN-I activity. The proportions of (D) CD14intCD16+ monocytes, (E) CD14++CD16- monocytes, and (F) CD1c+ myeloid dendritic cell subsets negatively correlate with IFN-I activity. Spearman rank correlation was used to determine significance. Values for Spearman r and P values are given for the different correlates.
Figure 6
Figure 6
Prednisone dose correlates with Mer expression on all three monocyte subsets in patients with SLE receiving prednisone; and prednisone treatment increases Mer expression on myeloid dendritic cells. (A) Spearman rank correlation was used to determine the significance of correlation between Mer levels in patients receiving prednisone and dose levels of the prednisone. Values for Spearman r and P value are given for the different correlates in the Table. (B) Mer levels on monocytes were compared between normal healthy controls and SLE patients not treated and treated with prednisone. (C) Mer levels on dendritic cells were compared between normal healthy controls and SLE patients not treated and treated with prednisone. Significance was determined by using the Mann-Whitney rank correlation test. Horizontal bars indicate the median values for the groups. *P < 0.05; **P < 0.001.
Figure 7
Figure 7
Levels of Mer on CD14intCD16+ monocytes positively correlate with the levels of Mer in the other monocyte subgroups and on CD1c+ myeloid DCs. Spearman rank correlation was used to determine significance. Values for Spearman r and P value are presented for the different subsets in the table.
Figure 8
Figure 8
Levels of Mer on CD14intCD16+ monocytes are negatively correlated with the proportion of CD14intCD16+ monocytes, the proportion of CD1c+ dendritic cells, and the proportion of pDCs in blood. Spearman rank correlation was used to determine significance. Values for Spearman r and P values are presented for the different correlations in the table.
Figure 9
Figure 9
Correlates of Mer levels in peripheral blood of lupus patients. (A) Mer levels on CD1c+ dendritic cells are negatively correlated with the proportion of pDCs in lupus blood. (B) sMer levels in blood are negatively correlated with the numbers of neutrophils in the blood of lupus patients. (C) Levels of Mer on the surface of CD4+ T cells are positively correlated with levels of Tyro 3.

Similar articles

Cited by

References

    1. Lai C, Lemke G. An extended family of protein-tyrosine kinase genes differentially expressed in the vertebrate nervous system. Neuron. 1991;6:691–704. doi: 10.1016/0896-6273(91)90167-X. - DOI - PubMed
    1. Lemke G, Burstyn-Cohen T. TAM receptors and the clearance of apoptotic cells. Ann N Y Acad Sci. 2010;1209:23–29. doi: 10.1111/j.1749-6632.2010.05744.x. - DOI - PMC - PubMed
    1. Scott RS, McMahon EJ, Pop SM, Reap EA, Caricchio R, Cohen PL, Earp HS, Matsushima GK. Phagocytosis and clearance of apoptotic cells is mediated by MER. Nature. 2001;411:207–211. doi: 10.1038/35075603. - DOI - PubMed
    1. Anderson HA, Maylock CA, Williams JA, Paweletz CP, Shu H, Shacter E. Serum-derived protein S binds to phosphatidylserine and stimulates the phagocytosis of apoptotic cells. Nat Immunol. 2003;4:87–91. - PubMed
    1. Lu Q, Lemke G. Homeostatic regulation of the immune system by receptor tyrosine kinases of the Tyro 3 family. Science (New York) 2001;293:306–311. doi: 10.1126/science.1061663. - DOI - PubMed

Publication types