. 2014 Mar 17;25(3):350-65.
doi: 10.1016/j.ccr.2014.02.005.

Angiocrine factors deployed by tumor vascular niche induce B cell lymphoma invasiveness and chemoresistance

Affiliations

Angiocrine factors deployed by tumor vascular niche induce B cell lymphoma invasiveness and chemoresistance

Zhongwei Cao et al. Cancer Cell. .

Abstract

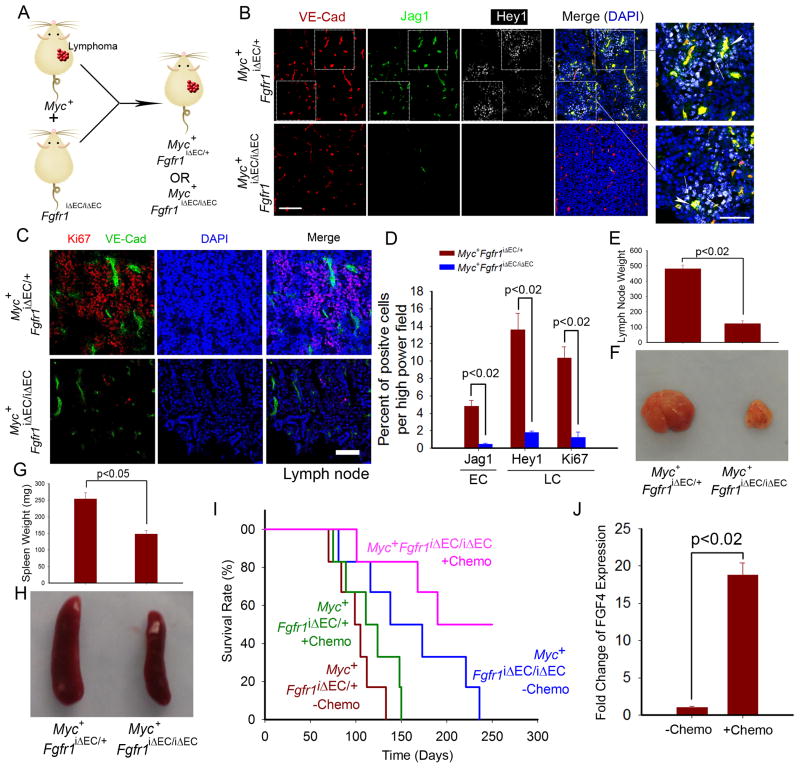
Tumor endothelial cells (ECs) promote cancer progression in ways beyond their role as conduits supporting metabolism. However, it is unknown how vascular niche-derived paracrine factors, defined as angiocrine factors, provoke tumor aggressiveness. Here, we show that FGF4 produced by B cell lymphoma cells (LCs) through activating FGFR1 upregulates the Notch ligand Jagged1 (Jag1) on neighboring ECs. In turn, upregulation of Jag1 on ECs reciprocally induces Notch2-Hey1 in LCs. This crosstalk enforces aggressive CD44(+)IGF1R(+)CSF1R(+) LC phenotypes, including extranodal invasion and chemoresistance. Inducible EC-selective deletion of Fgfr1 or Jag1 in the Eμ-Myc lymphoma model or impairing Notch2 signaling in mouse and human LCs diminished lymphoma aggressiveness and prolonged mouse survival. Thus, targeting the angiocrine FGF4-FGFR1/Jag1-Notch2 loop inhibits LC aggressiveness and enhances chemosensitivity.


Figures

Figure 1
Figure 1. Expansion of Myc+ LCs with aggressive LIC features after co-culture with ECs in serum and cytokine-free conditions
(A) Representative images of Eμ-Myc mouse LCs cultured with EC. Scale bar= 200 μm. (B) Quantification of LC number of Eμ-Myc mouse LCs cultured in the absence of ECs (LC), with EC (LCEC), or with serum supplementation (LCSerum). *, p<0.02; n= 5. All data are presented as mean±SEM throughout. (C, D) Representative image (C) and the colony number (D) of colony forming capacity of LCs after serial passage. Five clones were passed every step. *p<0.02; Scale bar= 500 μm. (E) Survival curve of NSG mice intraperitoneally (i.p.) transplanted with the indicated numbers of LCs; n= 6–8. (F, G) Quantification (F) and representative image (G) of proliferation of LCs after treatment of indicated concentrations of doxorubicin. n= 5. Scale bar= 1000 μm. (H) Survival of NSG mice inoculated with 1x10⁵ indicated LCs and treated or not treated with doxorubicin (chemo) as indicated; n= 6–8. (I) Heat-map presenting the expression level of indicated transcripts in LCEC and LCSerum. (J) Representative flow cytometry graph of CD44 and IGF1R expression in LCs. (K) Representative time-lapse microscopy image of single colony expansion of LCEC (top) and flow cytometry analysis of the clonally derived CD44+IGF1R+CSF1R+ LCs (bottom). Scale bar= 25 μm. (L, M) Serial colony forming ability (L) and growth inhibition after doxorubicin treatment (M) comparing CD44+IGF1R+CSF1R+ and CD44IGF1RCSF1R LCs. *, p<0.025; n= 4. (N) Tumorigenicity of indicated LCs was compared by limiting dilution transplantation into NSG mice; n= 6 and 10 in CD44+IGF1R+CSF1R+ and CD44IGF1RCSF1R LC-injected groups, respectively. (O) Survival of NSG mice implanted with 105 indicated LCs then treated with or without 50 mg/kg doxorubicin; n= 6–10.See also Figure S1 and Table S1.
Figure 2
Figure 2. Angiocrine effects of endothelial Jag1 on Notch2 activation and propagation of Myc+ mouse LCs
(A) Expression level of Notch pathway effecter Hey1, Hes1, and Hey2 in LCs. (B) Approaches to define Notch pathway activation in mouse LCs. Notch1, Notch2 and Hey1 in LCs was silenced by shRNA (shNotch1, shNotch2, shHey1), and Notch pathway was blocked by compound E. Cell expansion, Notch activation, colony formation, and hepatic invasiveness were then compared. (C, D) Quantification (C) and representative image (D) of expansion of LCs co-cultured with ECs (LC+EC) or cultured in serum-free medium (LC). Srb, scrambled shRNA; OE Hey1, overexpression of Hey1; n= 4; Scale bar= 25 μm. (E, F) Notch1 and Notch2 intracellular domains (ICD) were detected in LCs by immunoblot (E) and Notch2 ICD in LCs was examined by immunostaining (F). White arrowheads indicate nuclear Notch2 ICD. Scale bar= 10 μm. (G) ChIP analysis of RBPJ activity in LCs after Notch inhibition. shN1 and shN2 denote shRNA against Notch1 and Notch2, respectively. n= 4. (H–K) Aggressive features of LCs were tested after disruption of Notch2-Hey1 pathway. Extra-nodal invasiveness of LCs was examined by intrasplenic injection into NSG mice (H). Hepatic tumor load was examined by H&E (I) and fluorescent microscopy (K). Quantification of hepatic tumor load is shown in (J); n= 4; Scale bar= 100 μm in (I) and 1 mm in (K). (L) Expression of Notch ligands in feeder ECs after co-culture with LCs (EC + LC); n= 4. (M, N) LCs were co-cultured with ECs transduced with Scrambled shRNA (ECSrb) and Jag1 shRNA (ECshJag1). Notch activation in LCs was tested by Hey1 upregulation (M) and fluorescent intensity of RBPJ-driven GFP reporter in LCs (N); n= 5. (O, P) Representative image (O) and expansion (P) of LCs cultured alone or co-cultured with ECShJag1 or ECSrb. *, p<0.025; n= 5. Scale bar= 50 μm. See also Figure S2.
Figure 3
Figure 3. Influence of angiocrine Jag1 on expansion and aggressive features of human B-Cell LCs
(A–C) Expression of Hey1 and Jag1 in patient Burkitt’s lymphoma with MYC translocation were examined. VE-cadherin was stained to identify ECs (A). Quantification of Jag1 expression in lymphoma ECs (B) and Hey1 in perivascular LCs (C) is shown. Scale bar = 100 μm and 20 μm in inset. (D) CD44 and IGF1R expression on human LCs cultured with ECs (LCEC) or with serum (LCSerum). (E, F) Immunoblot analysis (E) and immunostaining (F) analysis of Notch ICD in LC cultured with serum or with indicated ECs. Scale bar= 25 μm. (G, H) Representative image (G) and quantification (H) of colony formation capacity of human LCSerum, and LCs co-cultured with ECs transduced with Scrambled (LCEC-srb) or Jag1 shRNA (LCEC-shJag1). n= 4; Scale bar= 100 μm. (I, J) Representative image of hepatic lymphoma (I) and quantification of tumor colony number burden (J) of human LCEC-srb or LCEC-shJag1 intrasplenically injected into NSG mice. LCSerum were also injected for comparison. Scale bar= 50 μm. (K–N) Inhibition of Notch1, Notch2, Hey1 was performed in human LCs before EC co-culture, and EC-dependent expansion (K, L) and hepatic tumor load of (M, N) of LCs were determined; n= 4; Scale bar= 1000 μm in (K) and 50 μm in (M). (O) Jag1 expression in host ECs within the hepatic lymphoma nodule was assessed 14 days after intrasplenic injection of human LCs into NSG mice. Lymphoma mass in the liver is denoted by dotted line. Scale bar= 50 μm (20 μm in inset). See also Figure S3 and Table S2.
Figure 4
Figure 4. Reciprocal instigatory interactions between LCs and co-cultured ECs in vitro and host ECs in vivo
(A) Expression of angiogenic factors VEGF-A, SDF1, FGF2, and FGF4 in mouse and human LCs co-cultured with ECs (LC + EC) or in serum-containing medium (LC); n=4. (B–D) ECs transduced with FGFR1 shRNA were stimulation with LC conditioned medium (CM). LCs were transduced with Scrambled (LCSrb) and Fgf4 shRNA (LCshFGF4). Jag1 and FGFR1 protein levels (B) and FGFR1 activation (as determined by phosphorylation of FRS-2) (C) in ECs were examined and quantification (D); n= 4. (E) After human LCs were transplanted into NSG mice via intrasplenic injection, Jag1 induction in ECs associated with hepatic lymphoma nodule was determined. Lymphoma mass is delineated from normal tissue by dotted line. Jag1 expression in lymphoma ECs is indicated in inset. Scale bar= 100 μm and 20 μm in inset. (F, G) Schematic representation of generating Fgfr1iΔEC/iΔEC and control Fgfr1iΔEC/+ mice (F) and quantification of growth of subcutaneously injected B6RV2 mouse LCs in these mice (G). (H–K) B6RV2 lymphoma in the liver was examined in Fgfr1iΔEC/iΔEC and control mice (H). Histological studies of hepatic tumor load was determined by H&E staining (I) and fluorescent microscopy scan (J) of liver lobe 14 days after intrasplenic injection of LCs. Proliferation of LCs was determined by Ki67 staining (K). Scale bar= 50 μm in (I), (K) and 1mm in (J). See also Figure S4.
Figure 5
Figure 5. Lymphoma propagation and chemoresistance in Eμ-Myc mice with EC-specific deletion of Fgfr1 (Myc+Fgfr1iΔEC/iΔEC)
(A) Generation of Myc+Fgfr1iΔEC/iΔEC and control Myc+Fgfr1iΔEC/+ mice. (B–D) Expression of Jag1 and Hey1 in lymphoma tissue was determined in Myc+Fgfr1iΔEC/iΔEC and control mice (B). White arrow indicates expression of Jag1 on VE-cadherin+ ECs. LC proliferation was tested by Ki67 staining (C). Quantification of Jag1 upregulation in ECs, Hey1 and proliferation marker Ki67 in LCs is presented in (D); n =4. Scale bar= 50 μm in B (20 μm in inset). (E–H) Weight (E, G) and representative images (F, H) of lymph node (E, F) and spleen (G, H) in Myc+Fgfr1iΔEC/iΔEC and control mice. n= 4. (I) Survival of Myc+Fgfr1iΔEC/iΔEC and control mice with or without treatment of 100 mg/kg of doxorubicin every week; n= 5–6. (J) FGF4 mRNA expression in LCs after treatment of doxorubicin; n= 4.
Figure 6
Figure 6. Acquisition of aggressive LIC-like features in LCs by Jag1-expressing vascular niche
(A–E) Aggressive traits of CD44IGF1RCSF1R indolent LC colonies after co-culture with ECs was investigated (A). CD44IGF1RCSF1R LC colonies were co-cultured with ECSrb and ECShJag1 and tested for colony forming capacity (B, C), CD44 and IGF1R expression (D), and lethality in NSG mice after injection of 5 x10³ indicated LCs (E). (F) Different LC colonies were transplanted into mice with EC-specific deletion of Jag1 (Jag1iΔEC/iΔEC). Jag1iΔEC/+ mice were used as control. (G, H) Propagation of CD44+IGF1R+CSF1R+ LCs in Jag1iΔEC/iΔEC and control mice was determined after subcutaneous (G) and intrasplenic transplantation. Representative H&E staining of liver is shown in (H); n= 4. Scale bar = 50 μm. (I, J) Acquisition of aggressive LIC features in CD44IGF1RCSF1R LCs after transplantation to control and Jag1iΔEC/iΔEC mice. LCs were isolated at day 28 after subcutaneous injection from enlarging tumor mass and analyzed for CD44, IGF1R, and CSF1R (I) and serial colony formation capacity (J). Each derived clone was injected into 3 mice. See also Figure S5.
Figure 7
Figure 7. Generation of invasive and chemoresistant triple-positive LC subpopulation in Myc+ mice with conditional deletion of Jag1 in ECs (Myc+Jag1iΔEC/iΔEC)
(A) Analysis of aggressive attributes of LCs from Myc+Jag1iΔEC/iΔEC and control Myc+Jag1iΔEC/+ mice. (B) Percentage of CD44+IGF1R+ LC subset in Myc+Jag1iΔEC/iΔEC and control mice. (C, D) Colony forming capacity of LCs. Five clones isolated from Myc+ mice were picked for each passage. Representative images (C) and quantification of colony (D) are shown. Scale bar = 500 μm. (E) Lethality of LCs from control (left) and Myc+Jag1iΔEC/iΔEC (right) mice after limiting dilution transplantation into NSG mice (E). (F) Survival of NSG mice injected with 105 indicated LCs with or without treatment of 50 mg/kg doxorubicin; n = 5–8. (G, H) Representative image (G) and quantification of tumor colony number (H) of hepatic tumor in NSG mice after injection of LCs. Scale bar= 1mm.
Figure 8
Figure 8. Chemoresistance of lymphoma in Myc+Jag1iΔEC/iΔEC and control Myc+Jag1iΔEC/+ mice
(A) To test the role of angiocrine Jag1 in stimulating chemoresistance, control and Myc+Jag1iΔEC/iΔEC mice were treated with doxorubicin at 100 mg/kg once a week for 4 consecutive weeks. (B) Survival rate of Myc+Jag1iΔEC/iΔEC and control mice. Chemo indicates mouse group treated with 100 mg/kg doxorubicin. (C, D) Jag1 expression in VE-cadherin+ ECs, Notch activation (GFP expression) in LCs was measured with or without chemotherapy (C). Quantification of GFP intensity is shown (D). Compound E was injected into control mice to compare the degree of Notch inhibition; n = 4; Scale bar= 50 μm. (E, F) TUNEL staining image (E) and quantification of TUNEL+ cells (F) in the lymphoma of Myc+ mice after chemotherapy; n = 4; Scale bar= 50 μm. (G) Angiocrine Jag1 activates Hey1 to stimulate the emergence of LCs exhibiting aggressive LIC features. Expanding LCs reciprocally activate FGFR1 on ECs and induce Jag1 upregulation, further reinforcing Jag1-mediated angiocrine support of aggressive LCs with LIC attributes. See also Figure S6.

Comment in

Similar articles

Cited by

References

    1. Aster JC, Pear WS, Blacklow SC. Notch signaling in leukemia. Annu Rev Pathol. 2008;3:587–613. - PMC - PubMed
    1. Beck B, Driessens G, Goossens S, Youssef KK, Kuchnio A, Caauwe A, Sotiropoulou PA, Loges S, Lapouge G, Candi A, et al. A vascular niche and a VEGF-Nrp1 loop regulate the initiation and stemness of skin tumours. Nature. 2011;478:399–403. - PubMed
    1. Benedito R, Roca C, Sorensen I, Adams S, Gossler A, Fruttiger M, Adams RH. The notch ligands Dll4 and Jagged1 have opposing effects on angiogenesis. Cell. 2009;137:1124–1135. - PubMed
    1. Bergers G, Hanahan D. Modes of resistance to anti-angiogenic therapy. Nat Rev Cancer. 2008;8:592–603. - PMC - PubMed
    1. Brantley-Sieders DM, Dunaway CM, Rao M, Short S, Hwang Y, Gao Y, Li D, Jiang A, Shyr Y, Wu JY, Chen J. Angiocrine factors modulate tumor proliferation and motility through EphA2 repression of Slit2 tumor suppressor function in endothelium. Cancer Res. 2011;71:976–987. - PMC - PubMed

Publication types

MeSH terms

Associated data