. 2014 Mar 20;10(3):e1004224.
doi: 10.1371/journal.pgen.1004224. eCollection 2014 Mar.

Modeling 3D facial shape from DNA

Affiliations

Modeling 3D facial shape from DNA

Peter Claes et al. PLoS Genet. .

Abstract

Human facial diversity is substantial, complex, and largely scientifically unexplained. We used spatially dense quasi-landmarks to measure face shape in population samples with mixed West African and European ancestry from three locations (United States, Brazil, and Cape Verde). Using bootstrapped response-based imputation modeling (BRIM), we uncover the relationships between facial variation and the effects of sex, genomic ancestry, and a subset of craniofacial candidate genes. The facial effects of these variables are summarized as response-based imputed predictor (RIP) variables, which are validated using self-reported sex, genomic ancestry, and observer-based facial ratings (femininity and proportional ancestry) and judgments (sex and population group). By jointly modeling sex, genomic ancestry, and genotype, the independent effects of particular alleles on facial features can be uncovered. Results on a set of 20 genes showing significant effects on facial features provide support for this approach as a novel means to identify genes affecting normal-range facial features and for approximating the appearance of a face from genetic markers.


Conflict of interest statement

The authors have declared that no competing interests exist.

Figures

Figure 1
Figure 1. Workflow for 3D face scan processing.
A) original surface, B) trimmed to exclude non-face parts, C) reflected to make mirror image, D) anthropometric mask of quasi-landmarks, E) remapped, F) reflected remapped, G) symmetrized, H) reconstructed.
Figure 2
Figure 2. PCA effects on facial morphology.
The effects of the first 10 PCs (A–J) on face shape change parameters (FSCPs). The effect as a magnitude of each quasi-landmark displacement is shown first, followed by the alternate transformations (grey faces), the area ratio between both, the curvatures on the transformations, the curvature ratio between both, and finally the normal displacement between both, which is the signed magnitude of the displacement of one quasi-landmark in the direction normal to the surface of the first transformation (left gray faces).
Figure 3
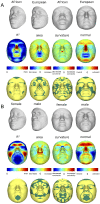
Figure 3. Transformations and heat maps showing how face shape is affected by (A) RIP-A and (B) RIP-S.
The top row of each panel shows the shape transformations three standard deviations below and above the mean of the RIPs in this sample. The second row shows the R2 (proportion of the total variation in each quasi-landmark) and the three primary facial shape change parameters: area ratio, curvature difference, and normal displacement. The bottom row shows in yellow the regions of the face that are statistically significantly different (p<0.001) between the two transformations. The max R2 values for RIP-A and RIP-S are 40.83% and 38.21%, respectively.
Figure 4
Figure 4. Relationships between the ancestry and sex RIP variables and their initial predictor variables.
(A) RIP-A with genomic ancestry; genomic ancestry is calculated using the core panel of 68 AIMs and RIP-A is calculated using this ancestry estimate on the set of three populations combined (N = 592). Populations are indicated as shown in the legend with United States participants shown with black circles, Brazilians with red circles, and Cape Verdeans with blue circles. (B) Histograms of RIP-S by self-reported sex.
Figure 5
Figure 5. Relationships between human observer rating and judgments of facial ancestry and sex.
(A) RIP-A and proportional ancestry ratings (r = 0.854, p<0.0001), (B) RIP-A and ancestry judgments (r = 0.859, p<0.0001), (C) RIP-S and femininity ratings (r = 0.860, p<0.0001), (D) RIP-S and sex judgments (r = 0.856, p<0.0001).
Figure 6
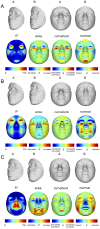
Figure 6. Transformations and heat maps showing how face shape is affected by three particular RIP-G variables.
The initial predictor variables are SNPs in the genes (A) SLC35D1 (B) FGFR1, and (C) LRP6. The top row of each panel shows the shape transformations near the extreme values of the particular RIP-G shown. The second row shows the R2 (proportion of the facial total variation), the three primary facial shape change parameters: area ratio, curvature difference, and normal displacement. The max R2 values for A, B, and C are 11.68%, 15.16% and 10.10%, respectively.

Comment in

References

    1. Carlson DS (2005) Theories of craniofacial growth in the postgenomic era. Seminars in Orthodontics 11: 172–183.
    1. Sperber GH (2001) Craniofacial development. (Decker Inc., Ontario, B.C.).
    1. Williams SE, Slice DE (2010) Regional shape change in adult facial bone curvature with age. American Journal of Physical Anthropology 143: 437–447. - PubMed
    1. Coussens AK, van Daal A (2005) Linkage disequilibrium analysis identifies an FGFR1 haplotype-tag SNP associated with normal variation in craniofacial shape. Genomics 85: 563–573. - PubMed
    1. Liu F, van der Lijn F, Schurmann C, Zhu G, Chakravarty MM, et al. (2012) A genome-wide association study identifies five loci influencing facial morphology in Europeans. PLoS Genetics 8: e1002932. - PMC - PubMed

Publication types