

doi: 10.1039/c3sm51877a.
Colloid-in-liquid crystal gels formed via spinodal decomposition
Affiliations
- PMID: 24651134
- PMCID: PMC4212980
- DOI: 10.1039/c3sm51877a
Item in Clipboard
Colloid-in-liquid crystal gels formed via spinodal decomposition
Soft Matter.
.
Abstract
We report that colloid-in-liquid crystal (CLC) gels can be formed via a two-step process that involves spinodal decomposition of a dispersion of colloidal particles in an isotropic phase of mesogens followed by nucleation of nematic domains within the colloidal network defined by the spinodal process. This pathway contrasts to previously reported routes leading to the formation of CLC gels, which have involved entanglement of defects or exclusion of particles from growing nematic domains. The new route provides the basis of simple design rules that enable control of the microstructure and dynamic mechanical properties of the gels.
Figures
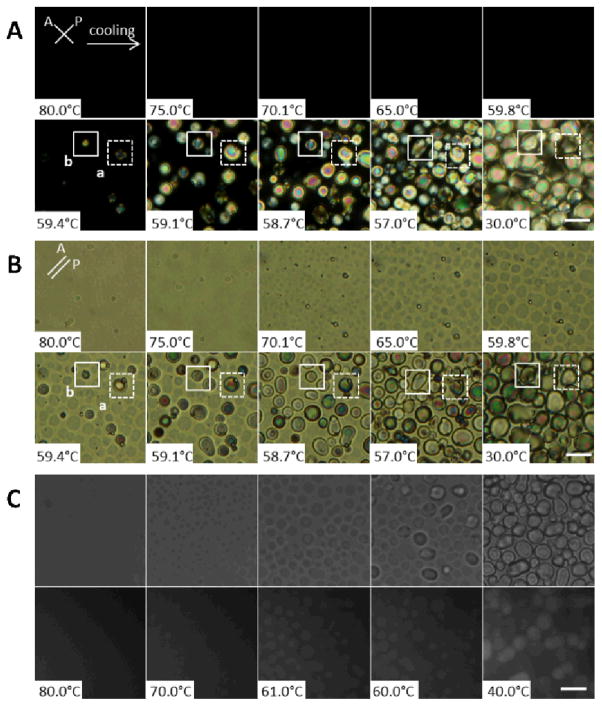
(A) Polarized light and (B) corresponding brightfield micrographs of a 13.3 wt% PS-colloid/E7 film at the indicated temperatures (cooling at a rate of 0.2°C/min). (C) Brightfield (top row) and fluorescence (bottom row) micrographs of a 13.3 wt% PS-colloid/E7 (doped with 0.1% Nile Red) film at the indicated temperatures (cooling at a rate of 0.2°C/min). The scale bars correspond to 20 μm.
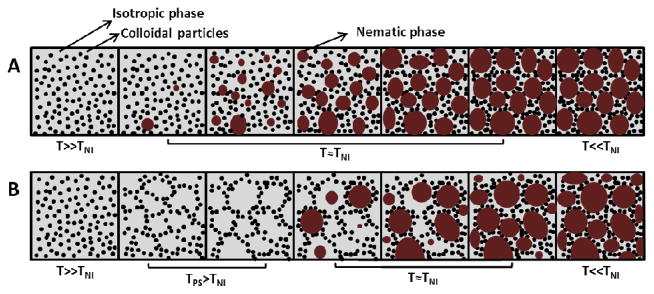
Schematic illustrations of two distinct pathways that lead to formation of CLC gels upon cooling of colloids dispersed initially in an isotropic phase of mesogens (the temperature decreases left to right) (A) The pathway proposed by Terentjev, Poon and coworkers for the PMMA colloids in 5CB. (B) The pathway identified in this study for PS-colloids in E7. (Gray: isotropic phase of the nematogens, black: colloids, red: nematic phase of the nematogens, T: temperature of the system, TNI: nematic-to-isotropic phase transition temperature of the pure nematogen, TPS: colloidal phase separation temperature.)
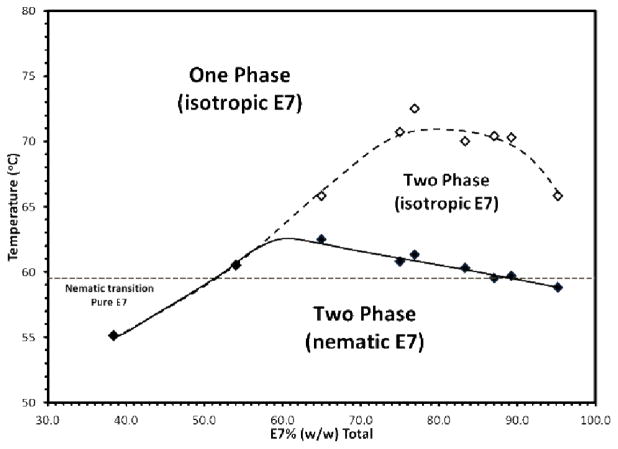
Phase behavior of PS-colloids in E7. Lines are drawn to guide the eye. All samples were sandwiched between two glass slides. Thickness of the samples: ~4 μm. See text for discussion of the effect of sample thickness on the system.
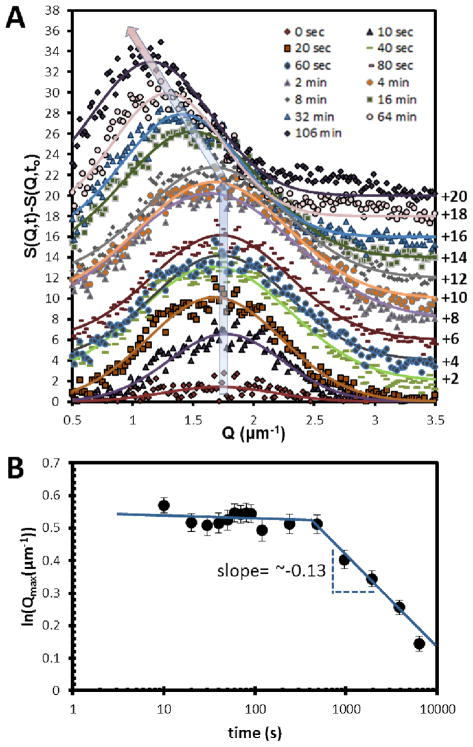
Microstructural characterization of a film of 13.3 wt% PS-colloids in E7 following a quench from 71.0°C to 67.0°C. (A) Change in the structure factor, S(Q,t) with time plotted as a function of Q. (B) Structural peak position, Qmax, plotted as a function of time. The thickness of the sample was ~4 μm.
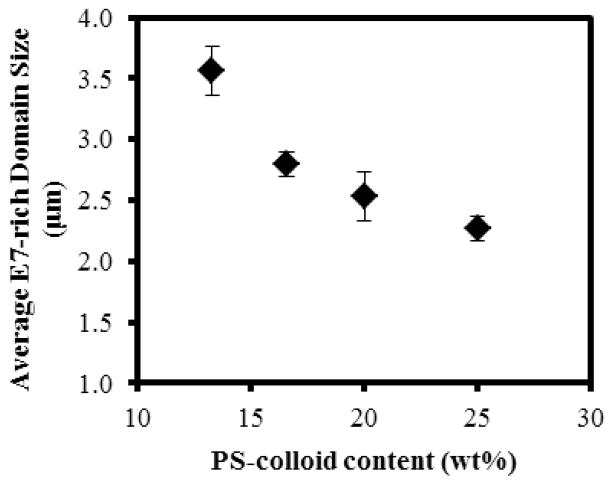
The average size of the E7-rich domains measured as a function of the PS-colloid concentration following a thermal quench at 10°C/min from 71°C to 67°C (see Methods for details). The thickness of the sample was ~4 μm. (n=3)
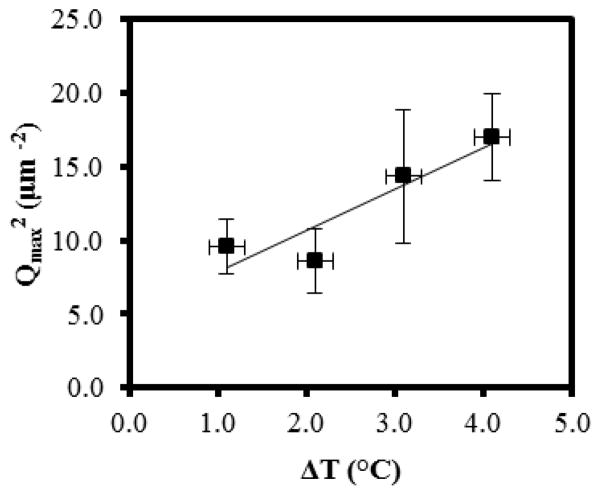
Dependence of Qmax2 on quench depth ΔT for a sample containing 13.3 wt% PS-colloid in E7 (thickness of ~4 μm). (n=4)
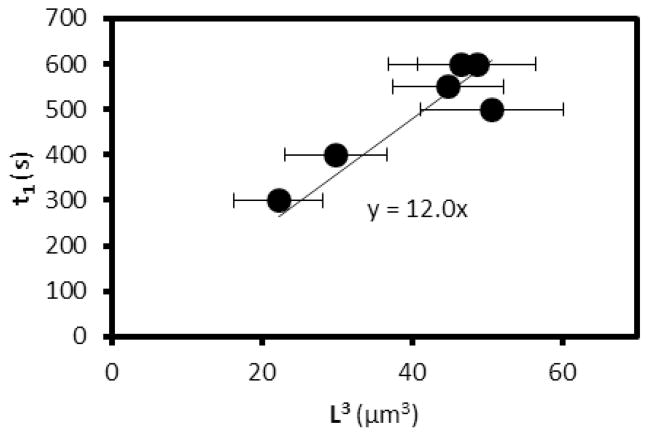
Plot of t1 as a function of L3, as predicted by eqn. (5). See text for discussion.
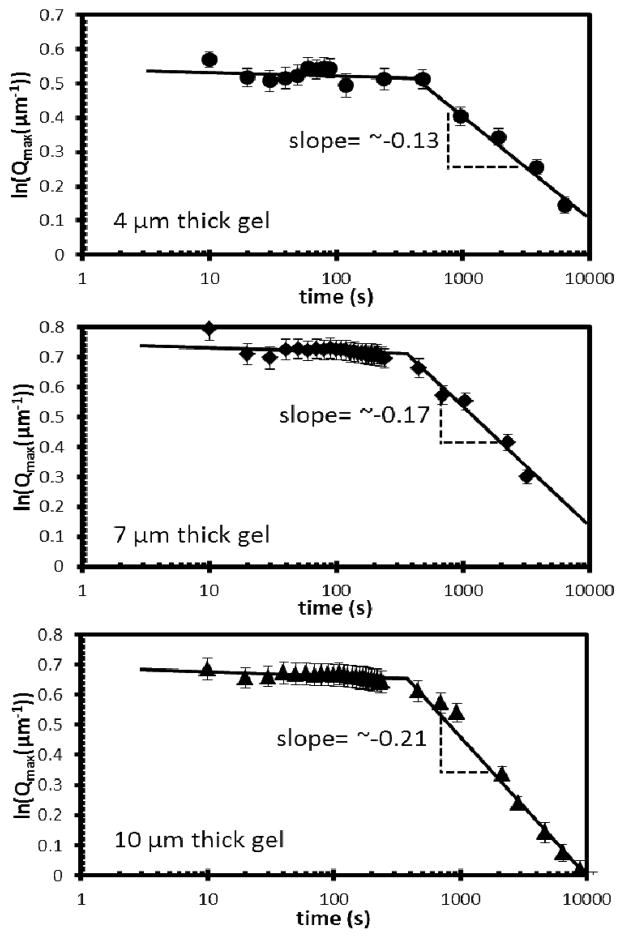
Structural peak position, Qmax, plotted as a function of time for 13.3 wt% PS-colloid/E7 films of indicated thicknesses. The temperature of each system was 67°C.
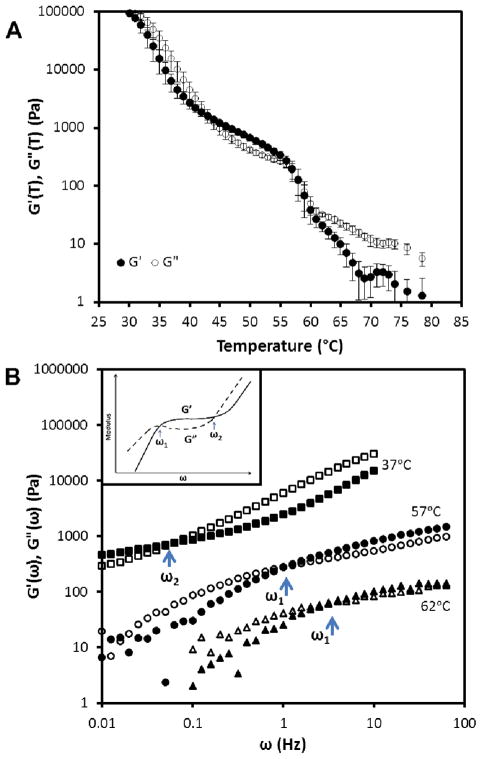
(A) Temperature (at 2 Hz, 2% strain) and (B) frequency (at 2% strain and indicated temperature) dependence of storage (filled symbols) and loss (open symbols) modulus of 13.3 wt% PS-colloids in E7. The inset in B shows an illustration of a typical frequency-response of a colloidal gel; fluidization for ω<ω1, elastic response for ω1<ω<ω2, viscous dissipation for ω>ω2.
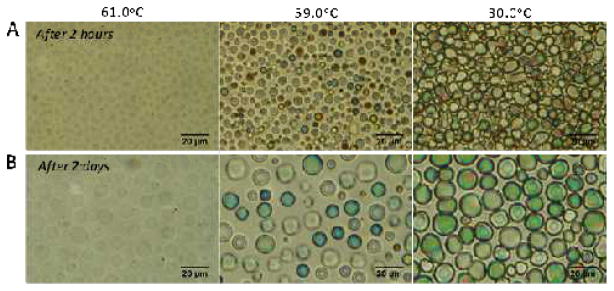
Bright-field micrographs of 13.3 wt% PS-colloid in E7 at the indicated temperatures (A) Sample after equilibration for 2 hours at 61.0°C following a rapid quench from 80.0°C. Subsequently, the sample was cooled to 59.0°C then 30.0°C at a rate of 0.2°C/min. (B) Sample after equilibration for 2 days at 61.0°C following a rapid quench from 80.0°C. Subsequently, the sample was cooled to 59.0°C then 30.0°C at a rate of 0.2°C/min.
Similar articles
-
Design of Responsive and Active (Soft) Materials Using Liquid Crystals.Annu Rev Chem Biomol Eng. 2016 Jun 7;7:163-96. doi: 10.1146/annurev-chembioeng-061114-123323. Epub 2016 Mar 10. Annu Rev Chem Biomol Eng. 2016. PMID: 26979412 Free PMC article. Review.
-
Hierarchical microstructures formed by bidisperse colloidal suspensions within colloid-in-liquid crystal gels.ACS Appl Mater Interfaces. 2015 Apr 8;7(13):7153-62. doi: 10.1021/am509008m. Epub 2015 Mar 30. ACS Appl Mater Interfaces. 2015. PMID: 25706308
-
Colloid-in-liquid crystal gels that respond to biomolecular interactions.Small. 2013 Aug 26;9(16):2785-92, 2784. doi: 10.1002/smll.201202869. Epub 2013 Apr 2. Small. 2013. PMID: 23554243 Free PMC article.
-
Morphology of spinodal decompositions in liquid crystal-colloid mixtures.J Chem Phys. 2008 Jun 14;128(22):224907. doi: 10.1063/1.2936831. J Chem Phys. 2008. PMID: 18554053
-
Recent advances in colloidal and interfacial phenomena involving liquid crystals.Langmuir. 2011 May 17;27(10):5719-38. doi: 10.1021/la103301d. Epub 2010 Nov 19. Langmuir. 2011. PMID: 21090596 Free PMC article. Review.
Cited by
-
Interfacial rheology and direct imaging reveal domain-templated network formation in phospholipid monolayers penetrated by fibrinogen.Soft Matter. 2019 Nov 28;15(44):9076-9084. doi: 10.1039/c9sm01519a. Epub 2019 Oct 25. Soft Matter. 2019. PMID: 31651923 Free PMC article.
-
Design of Responsive and Active (Soft) Materials Using Liquid Crystals.Annu Rev Chem Biomol Eng. 2016 Jun 7;7:163-96. doi: 10.1146/annurev-chembioeng-061114-123323. Epub 2016 Mar 10. Annu Rev Chem Biomol Eng. 2016. PMID: 26979412 Free PMC article. Review.
-
Topological defects in liquid crystals as templates for molecular self-assembly.Nat Mater. 2016 Jan;15(1):106-12. doi: 10.1038/nmat4421. Epub 2015 Sep 21. Nat Mater. 2016. PMID: 26390324 Free PMC article.
-
Reversible Microscale Assembly of Nanoparticles Driven by the Phase Transition of a Thermotropic Liquid Crystal.ACS Nano. 2023 Jun 13;17(11):9906-9918. doi: 10.1021/acsnano.2c09203. Epub 2023 May 24. ACS Nano. 2023. PMID: 37222568 Free PMC article.
-
Symmetry constraints during the development of anisotropic spinodal patterns.Sci Rep. 2016 Feb 10;6:20806. doi: 10.1038/srep20806. Sci Rep. 2016. PMID: 26860067 Free PMC article.
References
-
- Zaccarelli E. Journal of Physics: Condensed Matter. 2007;19:1–50.
-
- Lu PJ, Weitz DA. Annual Review of Condensed Matter Physics. 2013;4:217–233.
-
- Lu PJ, Zaccarelli E, Ciulla F, Schofield AB, Sciortino F, Weitz DA. Nature. 2008;453:499–503. - PubMed
-
- Verduin H, Dhont JKG. Journal of Colloid and Interface Science. 1995;172:425–437.
-
- Trappe V, Prasad V, Cipelletti L, Segre PN, Weitz DA. Nature. 2001;411:772–775. - PubMed
Publication types
MeSH terms
Substances
Grants and funding
LinkOut - more resources
Full Text Sources
Other Literature Sources