Review
. 2014 Mar 21;10(11):1644-59.
doi: 10.1039/c3sm51910d.

Physics of cell adhesion: some lessons from cell-mimetic systems

Affiliations
Review

Physics of cell adhesion: some lessons from cell-mimetic systems

Erich Sackmann et al. Soft Matter. .

Abstract

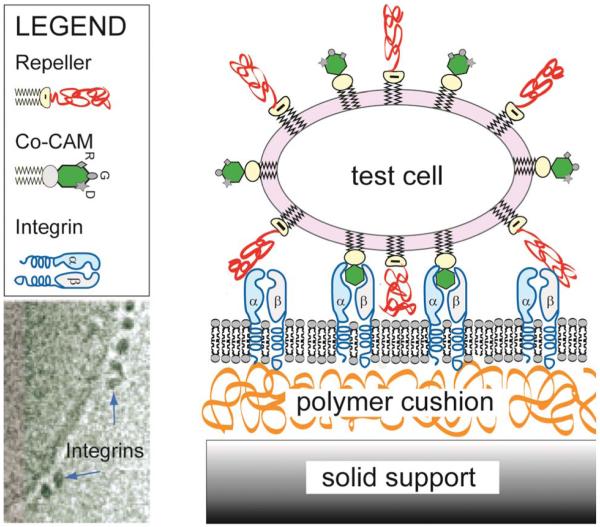
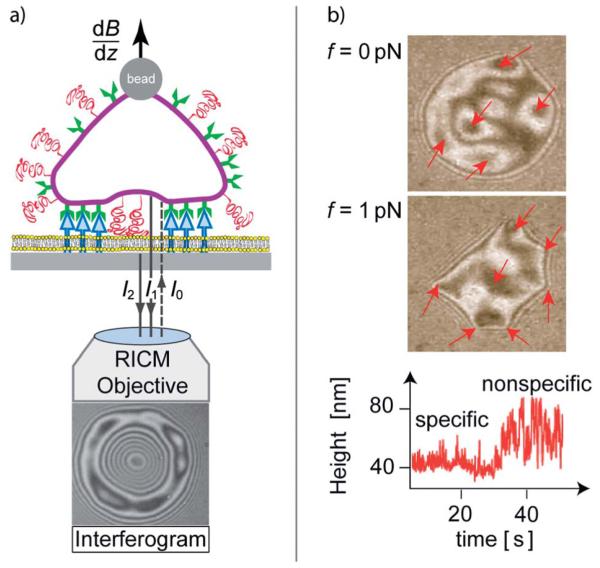
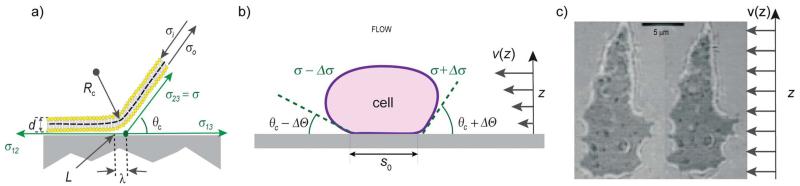
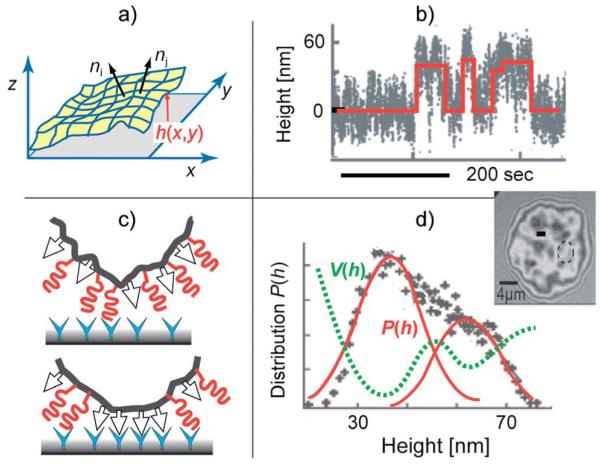
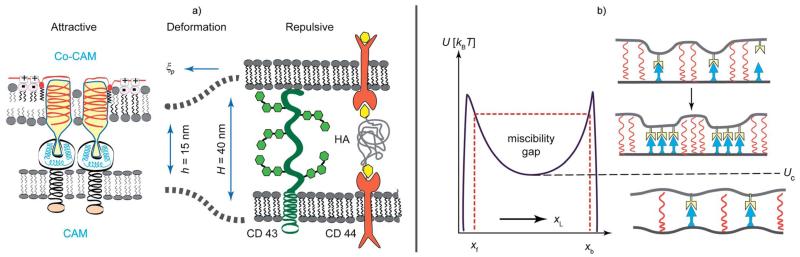
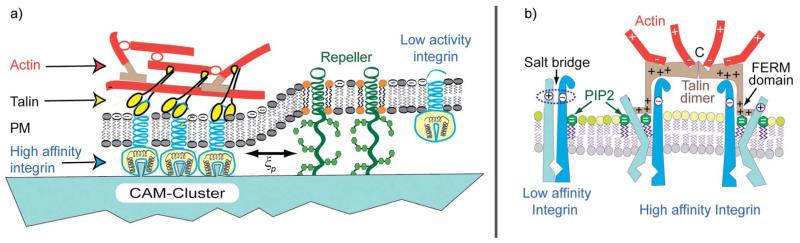
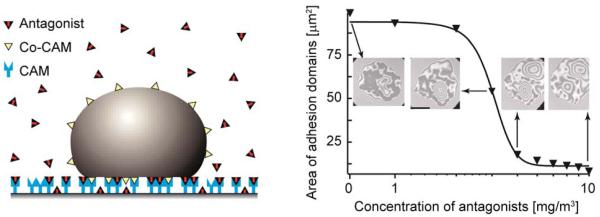
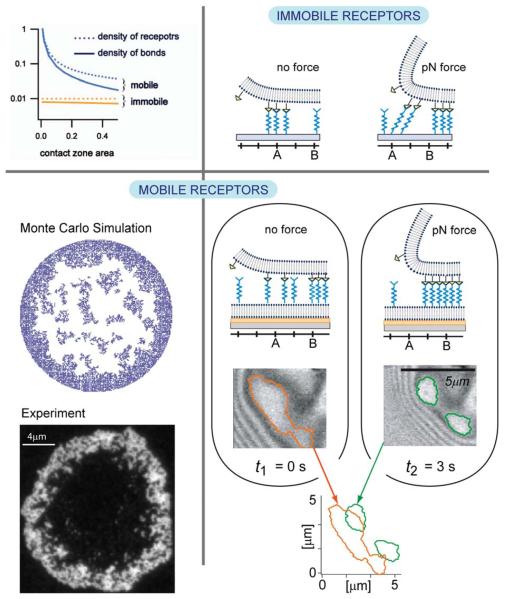
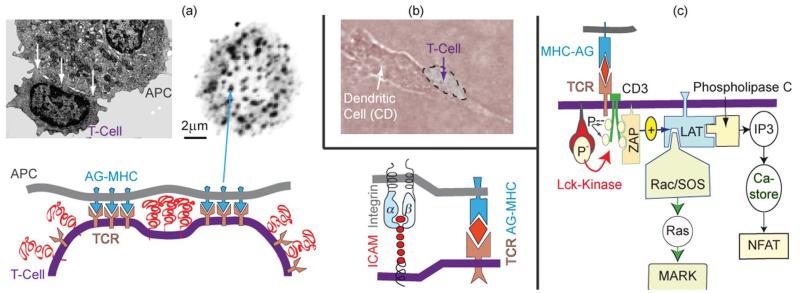
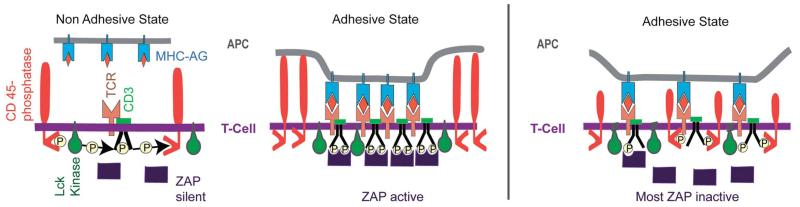
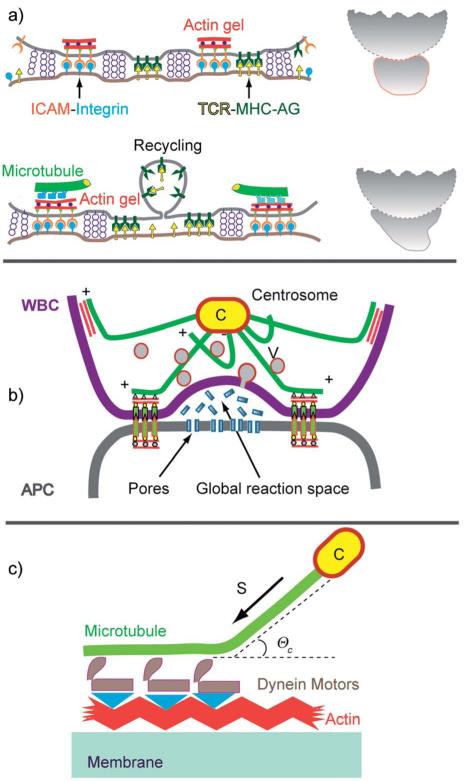
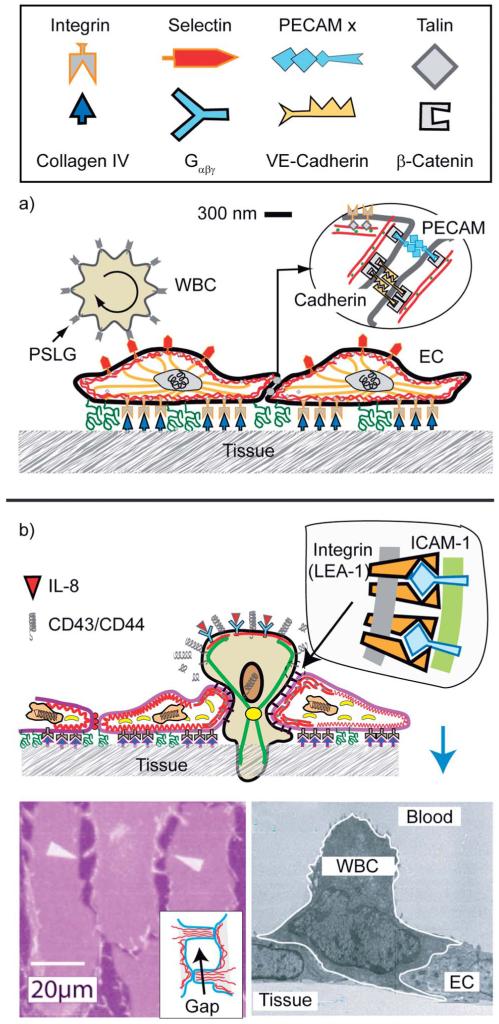
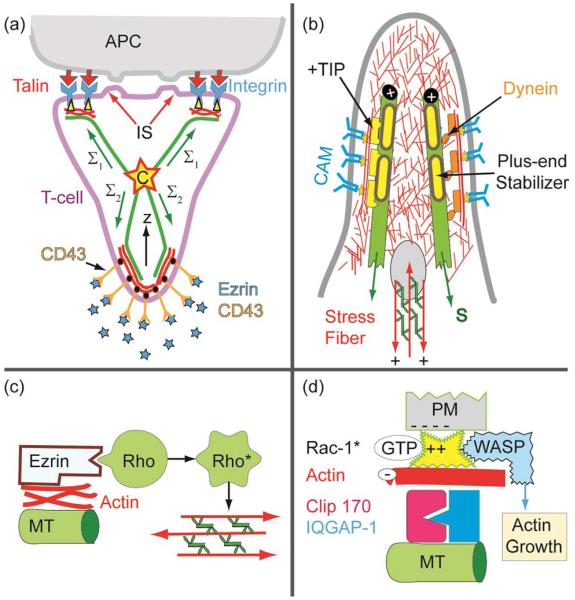
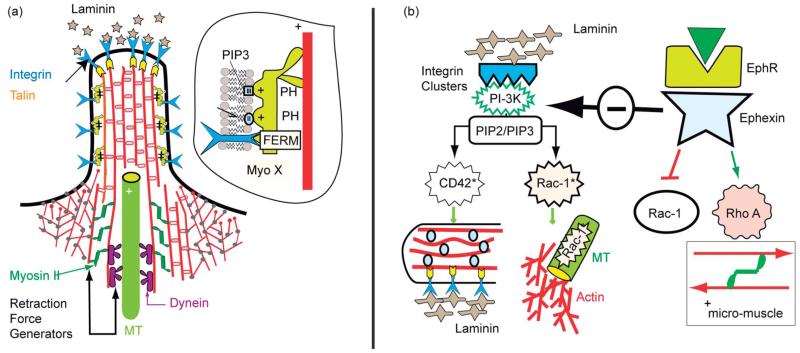
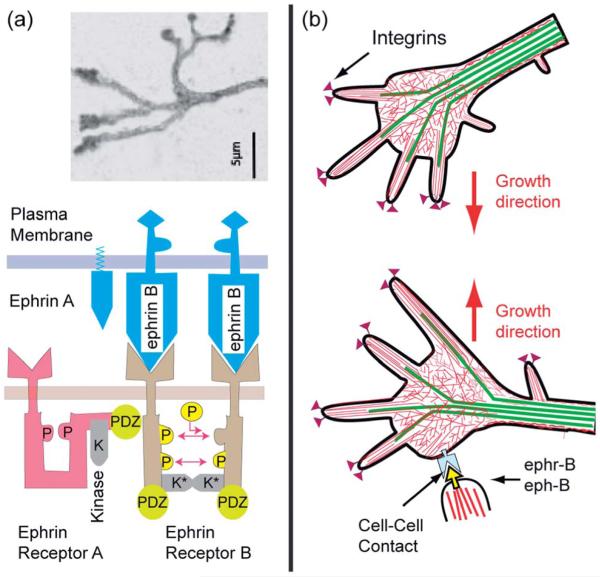
Cell adhesion is a paradigm of the ubiquitous interplay of cell signalling, modulation of material properties and biological functions of cells. It is controlled by competition of short range attractive forces, medium range repellant forces and the elastic stresses associated with local and global deformation of the composite cell envelopes. We review the basic physical rules governing the physics of cell adhesion learned by studying cell-mimetic systems and demonstrate the importance of these rules in the context of cellular systems. We review how adhesion induced micro-domains couple to the intracellular actin and microtubule networks allowing cells to generate strong forces with a minimum of attractive cell adhesion molecules (CAMs) and to manipulate other cells through filopodia over micrometer distances. The adhesion strength can be adapted to external force fluctuations within seconds by varying the density of attractive and repellant CAMs through exocytosis and endocytosis or protease-mediated dismantling of the CAM-cytoskeleton link. Adhesion domains form local end global biochemical reaction centres enabling the control of enzymes. Actin-microtubule crosstalk at adhesion foci facilitates the mechanical stabilization of polarized cell shapes. Axon growth in tissue is guided by attractive and repulsive clues controlled by antagonistic signalling pathways.


Figures

Fig. 1
Fig. 1
The model system mimicking cell–cell adhesion contains all major ingredients that control the primary process of cell adhesion, which consists of functionalised vesicle binding to a flat substrate acting as a target cell. The latter is generated by fusing vesicles doped with CAM molecules on hydrated polymer cushions, rendering the CAM mobile. In the current example, cyclic peptides exposing RGD sequences in the vesicle specifically recognize freely diffusing integrin α11β3 on the substrate (diffusivity: D ≈ 0.6 μm2 s−1)., The electron microscopy image of reconstituted integrins (bottom left) is reproduced from ref. .
Fig. 2
Fig. 2
Left: schematic view of image formation by reflection interference contrast microscopy (RICM) by interference of light reflected from the cell (I1) and the substrate surface (I2). Lift forces are generated by super-paramagnetic magnetic tweezers subjected to inhomogeneous magnetic fields (dB/dz). Right: interferogram of a test cell adhering to integrin receptors immobilized on the substrate, prior (top) and while applying a lift force of 1 pN (middle). Some initially visible adhesion domains are indicated by arrows. They are revealed by the formation of dark patches in the absence or of sharp edges in the presence of lift forces. The bottom-right panel shows the time evolution of membrane fluctuations during unbinding of an adhesion domain.
Fig. 3
Fig. 3
Left: mechanical equilibrium of the interfacial tensions in the radial direction of the adhering shell. The contact line Lc marks the transition between the adhering and non-adhering zones. The contact tension σ12 and σ13 are measures of the interfacial energies between the supported membrane and the vesicle surface and the aqueous phase, respectively. σ23 = σ is the surface tension of the vesicle. Middle: independent measurement of σ, κ and the free adhesion energies of adhering Dictyostelium cell by contour analysis in the presence and absence of a hydrodynamic flow field. Right: RICM image in the absence (left) and presence (right) of a hydrodynamic flow field. Image adopted from ref. . The adhesion strength could be extracted following the discussion in the Appendix of ref. .
Fig. 4
Fig. 4
Nucleation of CAM–CAM pairs driven by membrane bending excitations. Top-left panel: characterization of the roughness by the local orientation of the membrane normal that is correlated with the coherence length ζp. Bottom-left panel: formation of CAM–CAM clusters by transient displacement of repellers from the site of the CAM–CAM contact. Top-right panel: time sequence of the distance between the membrane from the solid surface h(t) at the particular position (measured by RICM at the site marked by a circle in the interferogram). The red line indicates the random transition of the membrane between the bound state 〈h 〉 ~30 nm and the unbound state at 〈h〉 ~60 nm. Bottom-right: bimodal height distribution Pf(h) defines the double well interfacial interaction potential according to V(h) ∝ kBT ln P(h). Image adapted from ref. .
Fig. 5
Fig. 5
Left panel: schematic view of three major forces controlling the primary phase of cell adhesion – (i) the short range attractive lock-and-key forces between CAM molecules act within the typical range of h ~ 15 nm. (ii) The repulsive forces mediated by membrane proteins with large extracellular domains (for example CD 45, CD 43 and ICAM) or hyaluronic acid (HA) molecules anchored to membrane receptors of the CD 44 family. (iii) Elastic stress caused by the length mismatch (Hh). The range of the deformation is determined by the persistence length ξp (eqn (3)). Right panel: phase diagram for adhesion. The ordinate shows the normalized bending energy and the abscissa the volume fraction of ligands. Uc marks the lower critical point of the miscibility gap. Above Uc, long range attraction of the isolated CAM–CAM pairs leads to the formation of microdomains. Bellow Uc a homogeneous state appears, which is realized for very low CAM concentrations and small height mismatches (Hh ≈ 0).
Fig. 6
Fig. 6
Left panel: coupling of actin gel patches to a CAM cluster of the integrin family by talin. The latter is associated with a dramatic increase of the integrin binding affinity. Right panel: molecular model of integrin activation by binding of the talin FERM domain to its β chain, resulting in the opening of the integrin binding pocket. The increase in affinity is mediated by the binding of the FERM domain of talin that uncouples the salt bridge between the integrin intracellular domains. Moreover, the FERM domain is also directly coupled to the membrane by electrostatic forces and phosphoinositides (PIP2/PIP3). Talin which forms dimers links two integrins and has several binding sites for F-actin. Thus actin gel patches can form without contribution of other actin cross-linkers. As a consequence, the formation of adhesion domains could be even mediated by local actin gelation.
Fig. 7
Fig. 7
Schematics of the model system used to study the control of the size of adhesion domains formed of CAM/Co–CAM bonds by competitive antagonists that inhibit CAMs. The graph represents the total area associated with tight adhesion domains within the adhesion disc, plotted as a function of antibody concentration in bulk solution. Dark areas in interferograms should be associated with adhesion domains.
Fig. 8
Fig. 8
Top-left panel: density of receptors and bonds as a function of the size of the adhesion zone. When mobile, the density of receptors increases despite the fact that the density in the bulk of the bilayer is kept constant. Bottom-left: ring-shaped self-assembled adhesion domains form due to the interplay of diffusion and affinity of binding. Top-right panel: schematic representation of the domain response to the force when the receptors are immobile. The bonds are stretched, break and reform on new receptors in the interior of the adhesion zone. Bottom-right panel: schematic representation of the domain response to the force when the receptors are mobile. The domains densify in response to the force by displacing intact bonds for up to several microns.
Fig. 9
Fig. 9
(a) Top left: electron micrograph showing T-cell adhering on antigen presenting cells (APCs) by generating domains of tight adhesion (see arrows) separated by unbound zones. Top right: direct visualization of adhesion domains by fluorescence labeling of the T-cell receptor (after ref. 3). Bottom left: schematic view of adhesion-induced domain formation. Bottom right: the adhesion domains are possibly formed by co-aggregation of TCR–AG–MHC and integrin–ICAM-1 linker pairs as discussed in ref. . (b) Phase contrast micrograph of a polarized T-cell adhering and migrating on the antigen presenting dendritic cell. (c) Simplified scheme of genetic expression of the cytokine interleukin II (IL-2) by binding of the MHC–AG complex to the T-cell receptor (TCR) which is tightly associated with the co-receptor CD3. The binding triggers the phosphorylation of the 4 tyrosine groups at CD3 which results in the attraction and activation of the effector ZAP. The excited ZAP triggers the activation of the strongly membrane-bound scaffolding protein LAT. This activated scaffolding protein recruits activator and adaptor proteins including the phopsholipase Cg and SLP76. The former induces the genetic expression through the transcription factor NFAT. SLP76 mediates the activation of the genetic expression via the MAPK mediated pathway. Both pathways must be activated to express IL-II and to elicit a true immune reaction. The image on the left panel of (a) and the phase contrast micrograph was reproduced from ref. .
Fig. 10
Fig. 10
Left panel: model of activation of T-cells by adhesion domains formed during the initial phase of T-cell–APC encounters (before the formation of large central SMACs). The kinase ZAP-70 is activated by binding to the phosphorylated tyrosine groups of the cytoplasmic chain of the co-receptor CD3. The non-adhesive state occurs due to the abolishment of ZAP activation by CD45-mediated ongoing de-phosphorylation of CD3. The adhesive state leading to the formation of immune synapse (IS) is promoted by the clustering of bound TCR–MHC–AG pairs, which results in the expulsion of the inhibitor CD45 from the reaction center by steric forces. Right panel: demonstration of the CD45 self-inhibition model by Choudhuri and collaborators. By reducing the length of the extracellular domain, CD45 can diffuse into the tight adhesion domain and prevent the activation of ZAP by continuous removal of phosphate groups at the CD3-coreceptor. The same effect was observed by prolongation of the extracellular domains of the MHC–receptor. In summary, the phosphatase CD45 plays a twofold role: it inhibits the CD3-phosphorylation, and, together with other glycoproteins of the glycocalyx (e.g. CD43), acts as a buffer molecule counteracting adhesion.
Fig. 11
Fig. 11
(a) Reorganisation of the T-cell–APC adhesion zone (left) and cell shape (right) suggested by visualisation of talin and Lck distribution. The top image shows the situation 3 min and the bottom 25 min after contact formation. The right panels show the contours of the cells redrawn from phase contrast micrographs. (b) Dome-like reaction space formed by cytotoxic T-cells adhering on infected target cells. The global shape is stabilized by microtubules linking the actin cortex to the centrosome (C). A second fraction of MT exhibits dangling plus ends which serve as tracks for the rapid transport of secretory vesicles and endosomes by dynein and kinesin motors. (c) Model of mechanical stabilisation of the cell shape by tangential coupling of MT to the actin cortex by dynein motors.
Fig. 12
Fig. 12
Schematic view of endothelial cell monolayers with adhering WBC in the resting state. The leucocyte (WBC; shown on the left side) exposes ~5000 microvilli (length 0.3–0.5 μm; width 150 nm). The number of PSLG-1 receptors (5 × 10⁵) is 100 times larger than that of microvilli, suggesting that the tip is coupled to several PSLG-1–selectins bonds. The WBCs expose receptors for cytokines (abbreviated as Gαβχ) which activate the cell through the heterogenous membrane bound GTPase Gαβγ. (b) Reproduced from E. Sackmann and R. Merkel, Lehrbuch der Biophysik, Wiley Verlag, Weinheim, 2010. Penetration of the excited lymphocyte through the ENC-layer triggered by cytokines (such as interleukin-8). They bind to specific receptors on the blood cells which increases the density of high affinity integrins LFA-1 on the WBCs while the repellant glycoproteins are removed from the front. Bottom left: electron micrograph showing activated cell (granulocyte) penetrating through the endothelial cell monolayer (reproduced from ref. 77) The driving force is provided by the gain in binding energy between integrin (LFA-1) and ICAM. Bottom right: opening of a gap between ENC monolayers by the hormone histamine and thrombin.
Fig. 13
Fig. 13
(a) Model of bipolar polarization of T-cells moving in lymph tissues and encountering an antigen exposing dendritic cell (see BOX Fig. 1a). Note that the mechanical cell stability is determined by the balance of the traction forces in the MT which can be generated by passive MT–actin coupling or dynein motors (Fig. 11c). (b) Detailed view of rear of polarized cells showing the MT–actin coupling by passive linkers (left) and dynein motors (right). The yellow bars on the MT plus ends stand for regulators of the actin polymerization such as the IQGAP/Clip 170 complex which activates the actin gelation (see (c)). (c) Mechanism of F-actin–MT coupling via the complex Clip 170/IQGAP1, which can recruit and activate Rac-1 which in turn activates the actin polymerization promotor WASP. (d) Activation of Rho-A GTPase coupled to the ezrin–MT complex. GTP-Rho-A triggers the activation of the myosin-light chain kinase (MLCK), resulting in the self-assembly of stress fibers (micro-muscles) which are coupled to adhesion domains.
Fig. 14
Fig. 14
Protrusion and retraction of filopodia. (a) Filopodium with partially penetrating microtubules and assemblies of actin–myosin II micro-muscles at the base of actin bundles. The MT tip can recruit Rac triggering the branched actin gel growth as shown in (b). At the base actin–myosin stress fibers can be formed by activated Rho-A GTPase which facilitate the retraction of the filopodia. The tip can form adhesion domains by binding of integrin to laminin clusters (see text). (b) Left side: activation of GTPase (Rac-1, Cdc42) through PI-3K*, stimulated by integrin–laminin clustering. The activated GTPases are bound to stable MT and to actin bundles via IQGAP/Clip 170 complexes (see GlossarSX). Thus branched and bundled actin gels can form. Right: activation of Rho-A by the ephrin mediated pathway which activates Rho A through the specific GEF ephhexin, but inhibits the PI-3K mediated pathway.
Fig. 15
Fig. 15
Ephrine mediated retraction of filopodia and redirection of axon growth. (a) Top: typical view of the tip of axon growing on laminin covered surfaces (modified after ref. 89). Bottom: schematic view of membrane bound signal molecules ephrins (A and B) and receptors ephr-B (of RTK type) embedded in the top and bottom membrane, respectively. The left side shows a single receptor in the sleeping and the right a dimer in the active conformation, in which the tails are mutually phosphorylated and the kinase K is activated. Note that the stimulation of the ephr-B occurs by mutual phosphorylation of the cytoplasmic domains of two receptors. Activation is therefore only triggered by clusters of eph-R (b) retraction of filopodia at bottom by activation of Rho-A GTPase through the interaction of the ligand eph-B, exposed by target neurons, with receptor ephr-B on a growing axon. The axon grows in a new direction.

References

    1. von Andrian UH, Chambers JD, McEvoy LM, Bargatze RF, Arforz KE, Butcher EC. Proc. Natl. Acad. Sci. U. S. A. 1991;88:7538–7542. - PMC - PubMed
    1. Bruinsma R, Behrisch A, Sackmann E. Phys. Rev. E: Stat. Phys., Plasmas, Fluids, Relat. Interdiscip. Top. 2000;61:4253–4267. - PubMed
    1. Smith A-S, Seifert U. Soft Matter. 2007;3:275–289. - PubMed
    1. Simson R, Wallraff E, Faix J, Niewöhner J, Gerisch G, Sackmann E. Biophys. J. 1998;74:514–522. - PMC - PubMed
    1. Weikl TR, Asfaw M, Krobath H, Rozycki B, Lipowsky R. Soft Matter. 2009;5:3213–3224.

Publication types

LinkOut - more resources