

Noise and analyzer-crystal angular position analysis for analyzer-based phase-contrast imaging
- PMID: 24651402
- PMCID: PMC4097604
- DOI: 10.1088/0031-9155/59/8/1877
Noise and analyzer-crystal angular position analysis for analyzer-based phase-contrast imaging
Abstract
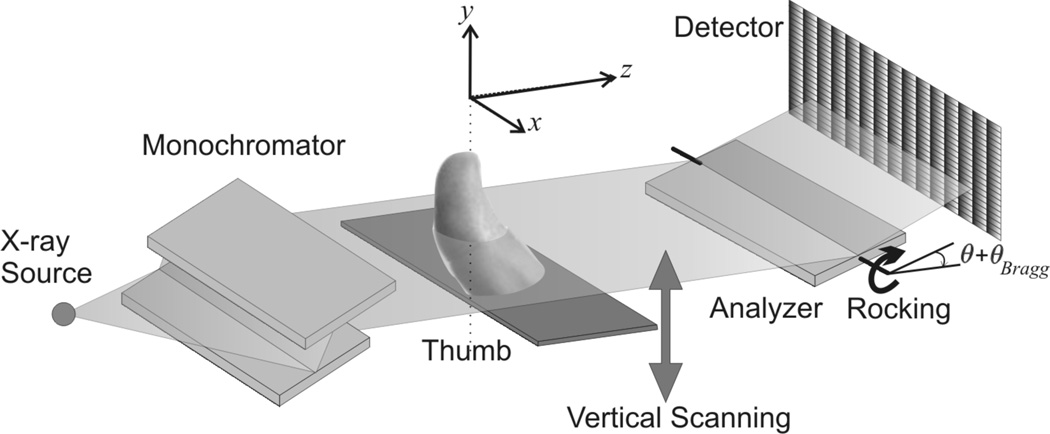
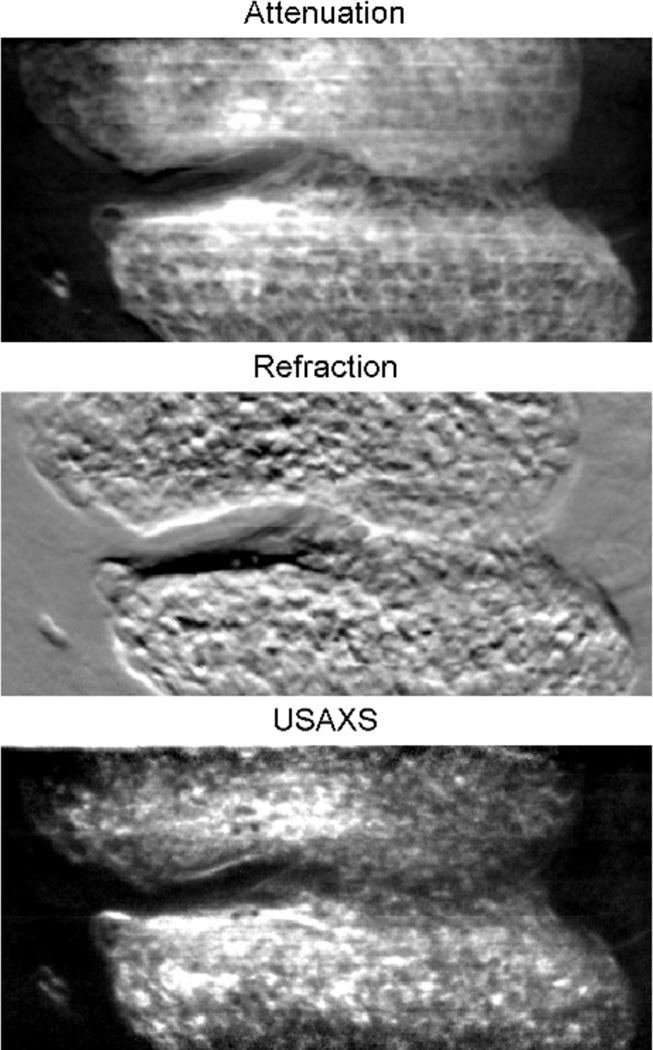
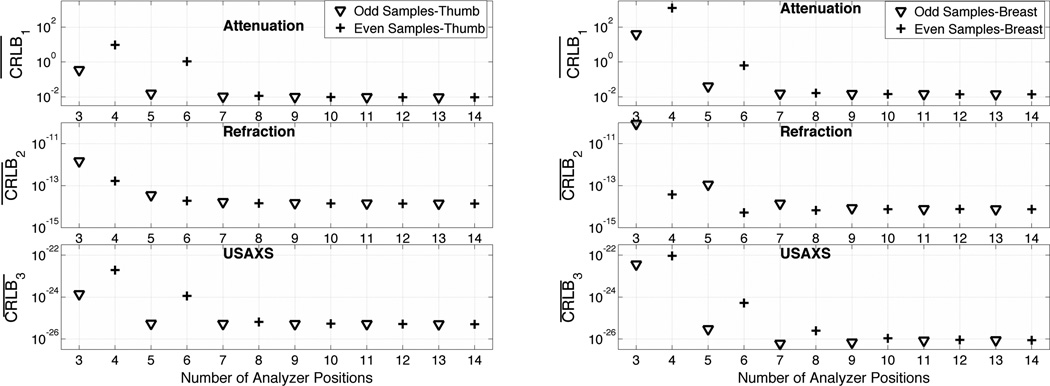
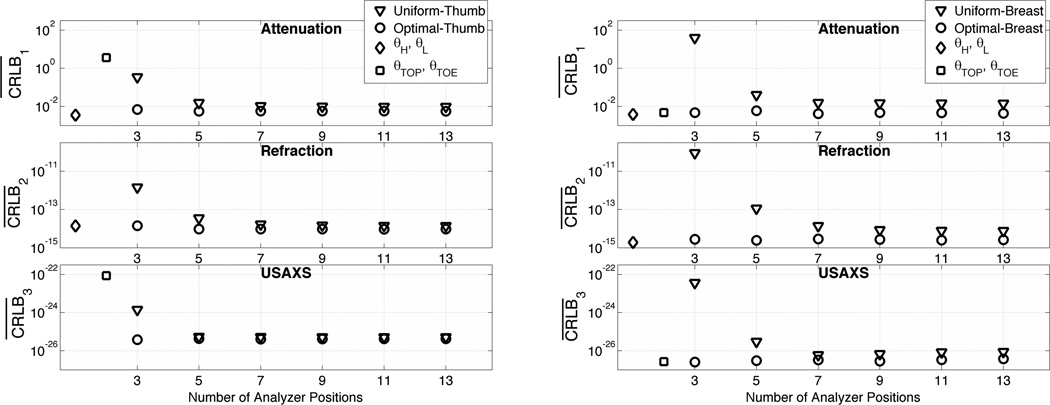
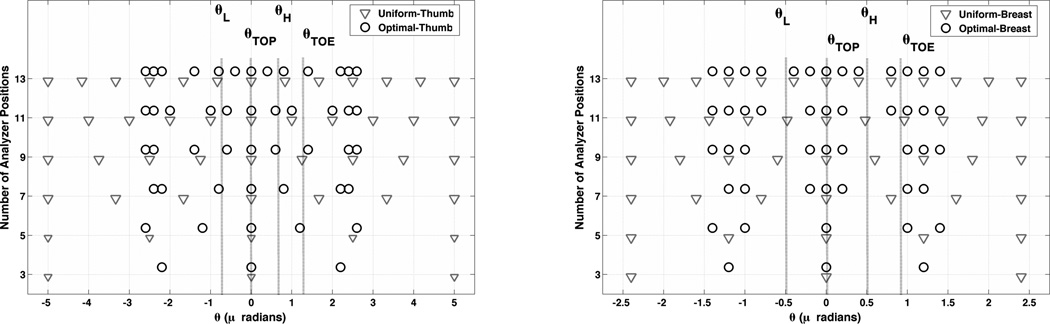
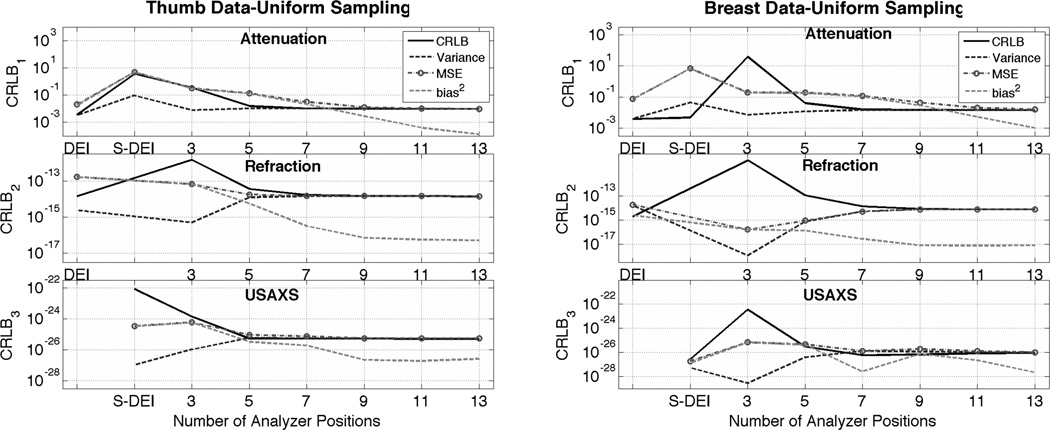
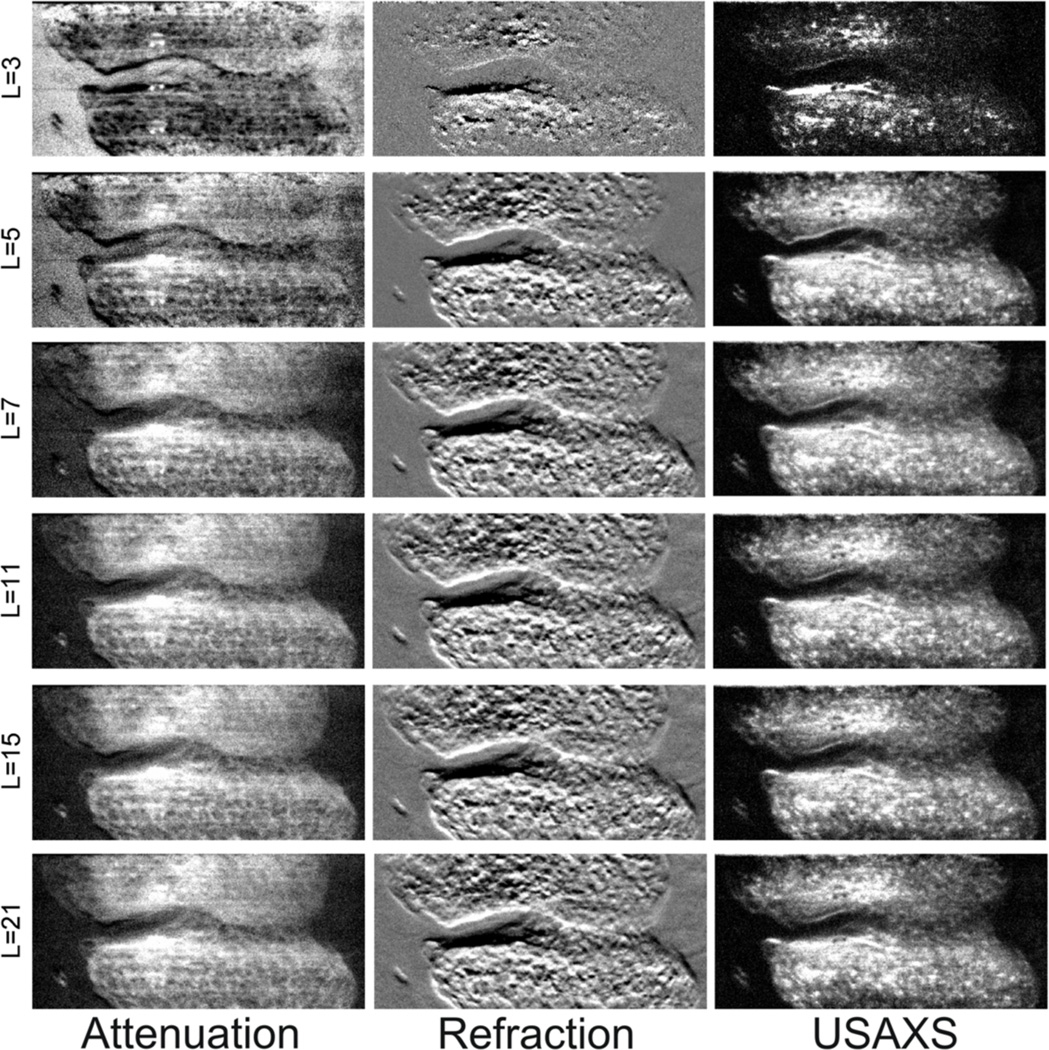
The analyzer-based phase-contrast x-ray imaging (ABI) method is emerging as a potential alternative to conventional radiography. Like many of the modern imaging techniques, ABI is a computed imaging method (meaning that images are calculated from raw data). ABI can simultaneously generate a number of planar parametric images containing information about absorption, refraction, and scattering properties of an object. These images are estimated from raw data acquired by measuring (sampling) the angular intensity profile of the x-ray beam passed through the object at different angular positions of the analyzer crystal. The noise in the estimated ABI parametric images depends upon imaging conditions like the source intensity (flux), measurements angular positions, object properties, and the estimation method. In this paper, we use the Cramér-Rao lower bound (CRLB) to quantify the noise properties in parametric images and to investigate the effect of source intensity, different analyzer-crystal angular positions and object properties on this bound, assuming a fixed radiation dose delivered to an object. The CRLB is the minimum bound for the variance of an unbiased estimator and defines the best noise performance that one can obtain regardless of which estimation method is used to estimate ABI parametric images. The main result of this paper is that the variance (hence the noise) in parametric images is directly proportional to the source intensity and only a limited number of analyzer-crystal angular measurements (eleven for uniform and three for optimal non-uniform) are required to get the best parametric images. The following angular measurements only spread the total dose to the measurements without improving or worsening CRLB, but the added measurements may improve parametric images by reducing estimation bias. Next, using CRLB we evaluate the multiple-image radiography, diffraction enhanced imaging and scatter diffraction enhanced imaging estimation techniques, though the proposed methodology can be used to evaluate any other ABI parametric image estimation technique.
Figures

References
-
- Anastasio MA, La Riviere P. Emerging imaging technologies in medicine. Boca Raton, FL: CRC Press; 2012.
-
- Arfelli F, Assante M, Bonvicini V, Bravin A, Cantatore G, Castelli E, Dalla Palma L, Di Michiel M, Longo R, Olivo A, Pani S, Pontoni D, Poropat P, Prest M, Rashevsky A, Tromba G, Vacchi A, Vallazza E, Zanconati F. Low-dose phase contrast x-ray medical imaging. Phys Med Biol. 1998;43:2845–2852. - PubMed
-
- Bonse U, Hart M. Tailless X-ray single-crystal reflection curves obtained by multiple reflection. Appl. Phys. Lett. 1965;7:238.
-
- Brankov JG, Wernick MN, Yang YY, Li J, Muehleman C, Zhong Z, Anastasio MA. Computed tomography implementation of multiple-image radiography. Med Phys. 2006;33:278–289. - PubMed
-
- Brankov JG, Zysk AM. In: Emerging Imaging Technologies in Medicine. Anastasio MA, Riviere PL, editors. Taylor & Francis; 2012. p. 368.
Publication types
MeSH terms
Grants and funding
LinkOut - more resources
Full Text Sources
Other Literature Sources