. 2014 Mar 20;5(3):e1131.
doi: 10.1038/cddis.2014.79.

P42 Ebp1 regulates the proteasomal degradation of the p85 regulatory subunit of PI3K by recruiting a chaperone-E3 ligase complex HSP70/CHIP

Affiliations

P42 Ebp1 regulates the proteasomal degradation of the p85 regulatory subunit of PI3K by recruiting a chaperone-E3 ligase complex HSP70/CHIP

H R Ko et al. Cell Death Dis. .

Abstract

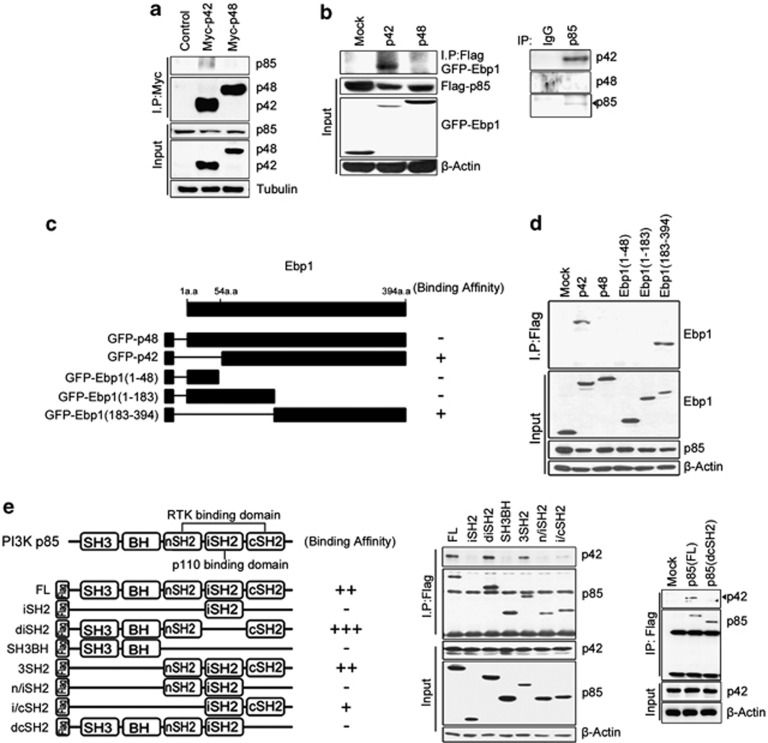
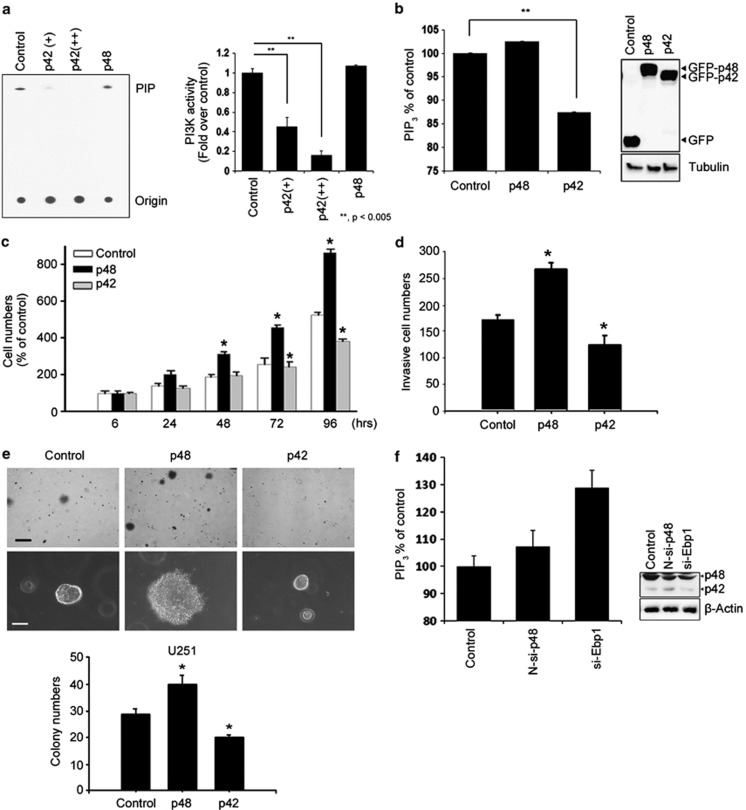
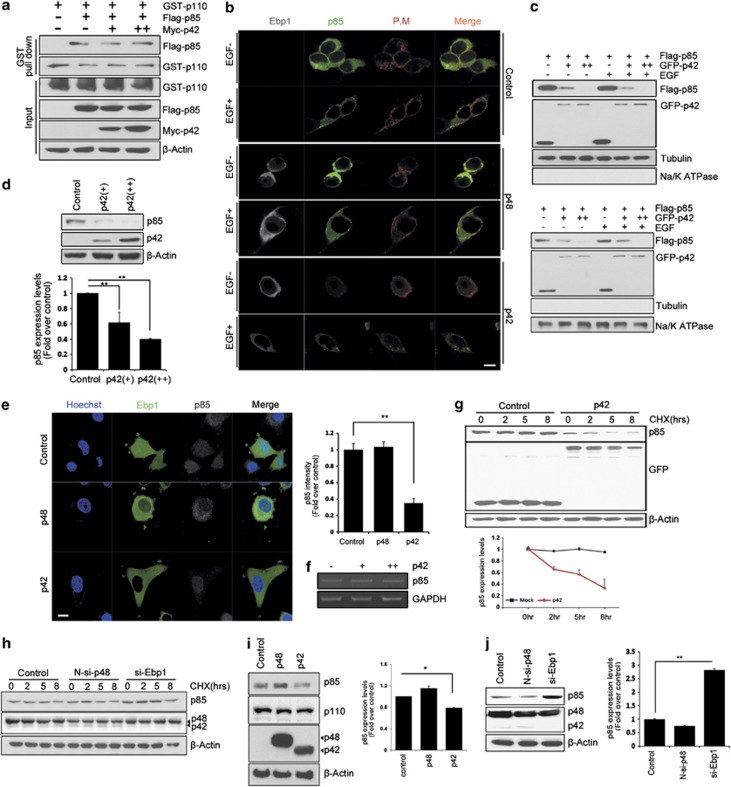
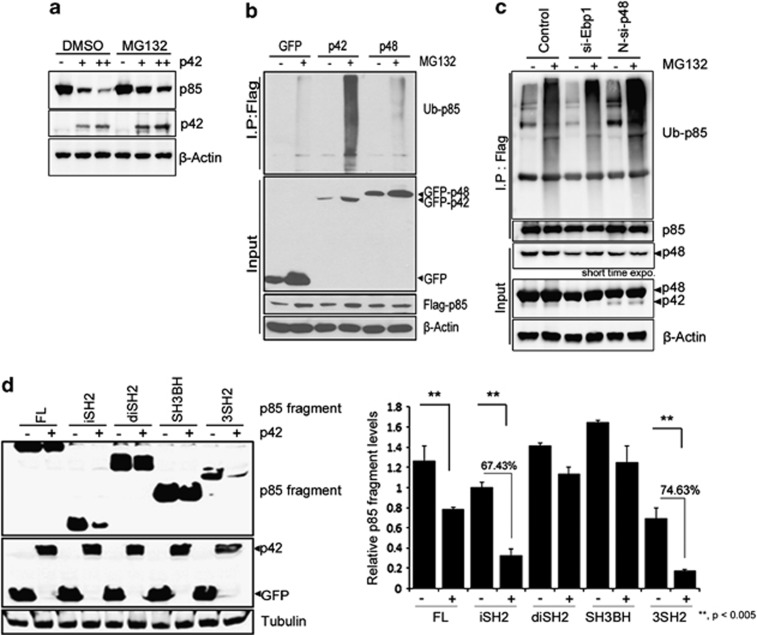
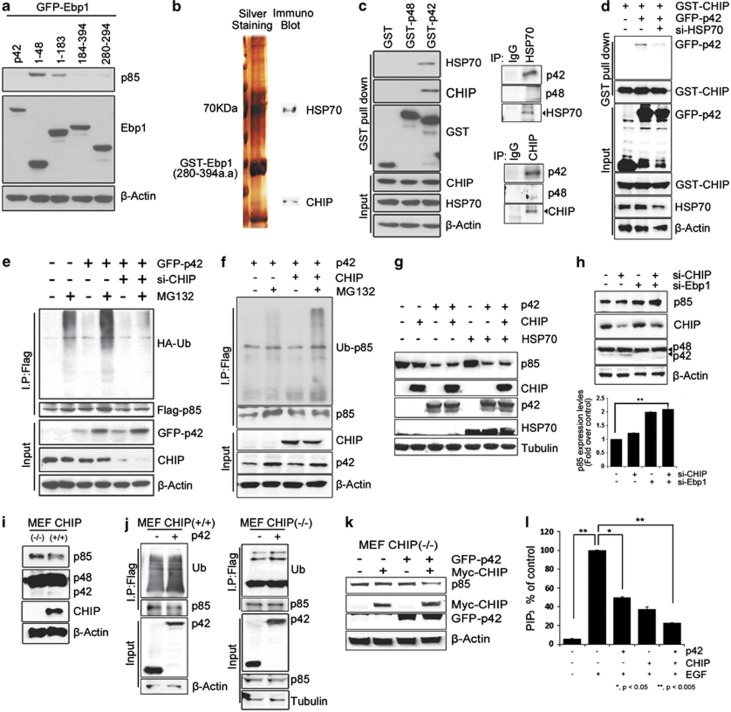
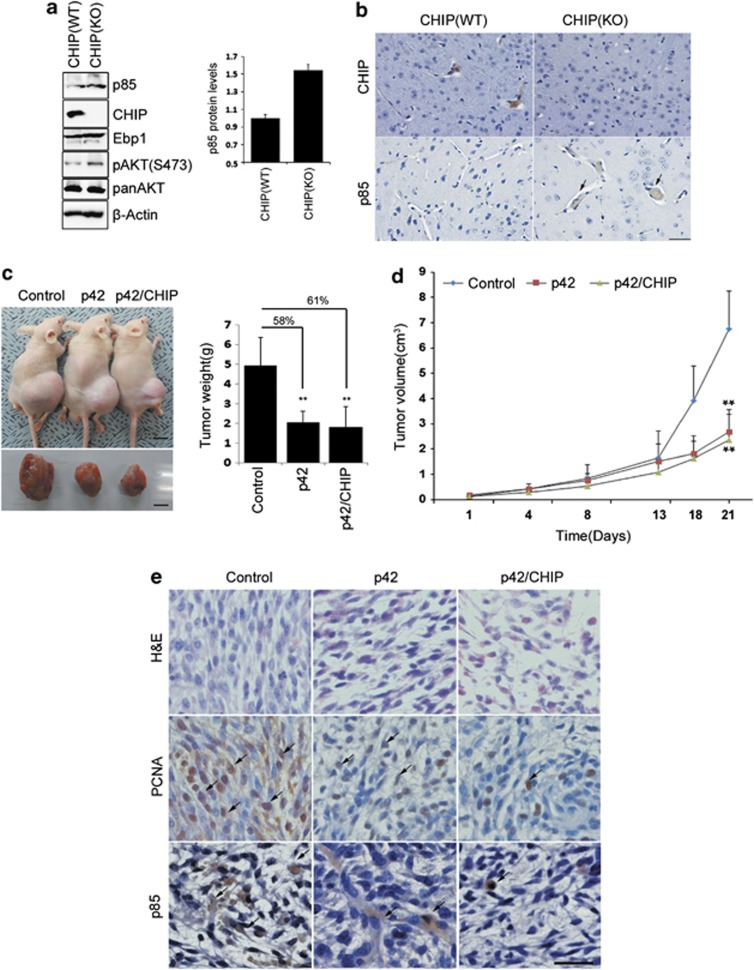
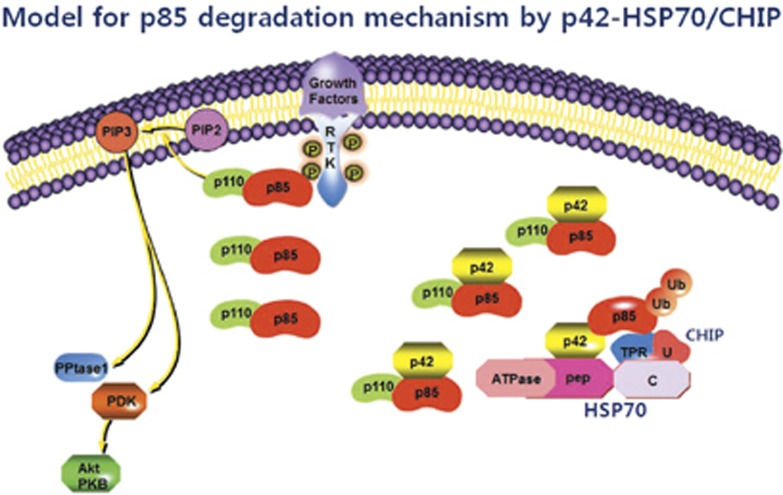
The short isoform of ErbB3-binding protein 1 (Ebp1), p42, is considered to be a potent tumor suppressor in a number of human cancers, although the mechanism by which it exerts this tumor-suppressive activity is unclear. Here, we report that p42 interacts with the cSH2 domain of the p85 subunit of phosphathidyl inositol 3-kinase (PI3K), leading to inhibition of its lipid kinase activity. Importantly, we found that p42 induces protein degradation of the p85 subunit and further identified HSP70/CHIP complex as a novel E3 ligase for p85 that is responsible for p85 ubiquitination and degradation. In this process, p42 couples p85 to the HSP70/CHIP-mediated ubiquitin-proteasomal system (UPS), thereby promoting a reduction of p85 levels both in vitro and in vivo. Thus, the tumor-suppressing effects of p42 in cancer cells are driven by negative regulation of the p85 subunit of PI3K.


Figures

Figure 1
Figure 1
The p42 specifically interacts with p85 regulatory subunit of PI3K. (a) HEK 293T cells were transfected as indicated. Cell lysates were immunoprecipitated with anti-Myc antibody, and endogenous p85 protein was determined by immunoblotting with the anti-p85 antibody. (b) Transfected cells were subjected to immunoprecipitation and immunoblotting as indicated (left). To detect endogenous interaction between p85 and p42 or p48, 293T cell lysates were immunoprecipitated with anti-p85 antibody and immunoblotting with anti-Ebp1 or anti-N-Ebp1 antibody (right). (c) Schematic diagram of the Ebp1 fragments. (d) Flag-p85 and GFP-Ebp1 co-transfected cells were immunoprecipitated with anti-Flag and immunoblotted as indicated. (e) The schematic diagram of various domains of the p85 subunit (left), and binding analysis between GFP-p42 and Flag-p85 fragments (right)
Figure 2
Figure 2
The p42 controls PI3K activity. (a) Cell lysates of p42 (1 and 3 μg) or p48 (3 μg) overexpressing cells were immunoprecipitated with anti-p85 antibody and labeled with 32P. Lipids were then extracted and analyzed for TLC. **P<0.005. (b) Cells expressing the indicated constructs were applied for the detection of PIP3 levels as described in the Materials and Methods. (c) U251 glioma cells expressing the indicated constructs were plated (5 × 10⁴ cells/60 mm dish) in complete medium and the viable cells were counted as indicated times. (d) An invasion assay was performed by plating the glioma cells expressing the indicated constructs onto matrigel-coated invasion chambers. Invasive cells were fixed and stained, and representative areas were photographed. Invasive cells were counted at × 100 magnification. (e) Representative digital microscopic images of colony-forming cells were assessed. Cells were fixed and stained with 0.1% crystal violet. Scale bar=500 μm (left upper), 100 μm (left bottom). In soft agar assays, cells stably expressing p48 and p42 were seeded on 0.35% soft agar (supplemented with complete medium) and cultured for 4 weeks (right). The colonies were counted at a magnification of × 40. Each value represents the mean±S.E.M. of triplicate measurements. *P<0.05 versus pEGFPC2 control. (f) SCR-, N-si-p48- or si-Ebp1-transfected cells were used in the PI3K activity assay
Figure 3
Figure 3
The p42 regulates p85 protein stability. (a) HEK293T cells were co-transfected with GST-p110 (2 μg) and Flag-p85 (2 μg) along with different concentrations of Myc-p42 (2 or 4 μg). The cell lysates (1 mg) were subjected to a GST pull-down assay, and the interaction between p85 and p110 was shown by immunoblotting with anti-Flag antibody. Protein expression was evaluated by immunoblotting. (b) Cells from the breast cancer cell line MCF7 were transfected with GFP-p85 (2 μg) and RED-plasma membrane marker (1.5 μg) together with control (2 μg), Myc-p42 (2 μg) or Myc-p48 (2 μg). The serum-starved MCF7 cells were incubated with or without EGF (50 ng/ml) for 5 min before processing for immunocytochemistry. Cells immunostained with anti-Myc were immunoreacted with Alexa Fluor 350 donkey anti-mouse secondary antibody and observed using a Zeiss confocal laser-scanning microscope. p48 or p42 (gray), plasma membrane (red) and p85 (green). Scale bar: 10 μm. (c) Cells were transfected with Flag-p85 along with control or GFP-p42 (2 or 4 μg). The serum-starved cells were treated with EGF (50 ng/ml) for 5 min. The cell lysates were subjected to subcellular fractionation for membrane and cytosolic fraction. p85 protein levels were evaluated by immunoblotting with anti-Flag antibody. The purity of each fraction was examined by anti-tubulin (cytosol) and anti-Na/K ATPas (membrane) antibodies. The cytosolic fraction was shown in upper and the membrane fraction was shown in bottom. (d) p85 protein levels were determined from control or Myc-p42 (2(+) and 4(++) μg)-transfected HEK 293 cells by immunoblotting (upper), and quantification is shown as a bar graph (bottom). (e) Transfected PC12 cells were stained with an anti-p85 and Alexa Flour 594 goat anti-mouse antibody (gray) and visualized using a confocal microscope LSM 710 (Zeiss). The nucleus was counterstained with Hoechst (blue). Scale bar: 10 μm. (f) HEK 293T cells were transfected with different concentrations of Myc-p42 (2 or 4 μg); after 48 h, RT-PCR was performed with the extracted total RNA using p85-specific primers. (g) Cells transfected with control or GFP-p42 were incubated with cycloheximide (CHX; 10 μg/ml) for the indicated times. p85 protein levels were analyzed by immunoblotting (upper). Quantification of p85 protein levels in control (square) and GFP-p42 (circle) cells are shown (bottom); values are expressed relative to time 0 (normalized to actin). (h) HEK 293T cells transfected with SCR, N-si-p48 or si-Ebp1 were incubated with CHX (10 μg /ml) for the indicated times. p85 protein levels were analyzed by immunoblotting. (i) Control, myc-p42- or p48-transfected cells were used to determine protein levels of p85 and p110 by immunoblotting (left). Densitometry analysis (right). *P<0.05 versus control. (j) Endogenous p85 levels were determined from PC12 cells silenced with SCR, N-si-p48 or si-Ebp1 (left). Densitometry analysis (right). **P<0.005 versus control
Figure 4
Figure 4
The p42 promotes p85 degradation through ubiquitin–proteasome system. (a) GFP-p42 (1 and 3 μg) was transfected into HEK293 cells, following exposure to 10 μM MG132 for 8 h. Immunoblotting was conducted to monitor p85, p42 or β-actin levels. (b) PC12 cells were co-transfected with HA-Ub and Flag-p85 and/or GFP-p42/p48 for 30 h and treated with MG132 (10 μM) for an additional 8 h. To obtain similar amount of immunoprecipitated Flag-p85, we transfected 0.5 μg of GFP-p42 while we transfected 1 μg of GFP or GFP-p48. Cell lysates were immunoprecipitated with anti-Flag and immunoblotted with anti-HA antibody. (c) HEK 293T cells were co-transfected with Flag-p85 and HA-Ub along with N-si-p48 or si-Ebp1 following exposure of MG132. Ubiquitinated p85 was detected by immunoblotting with anti-HA antibody. (d) Cells were transfected with various Flag-p85 fragments with or without GFP-p42, and p85 levels were determined by anti-Flag antibody (left). Densitometry analysis (right). **P<0.005
Figure 5
Figure 5
The p42 recruits a chaperone-E3 ligase complex HSP70/CHIP for p85 degradation. (a) HEK293T cells were transfected with various GFP-Ebp1 fragments, and p85 levels were examined by immunoblotting. (b) p42 interacts with HSP70 and CHIP. 293T cells were transfected with GST-Ebp1 (280–394 a.a.). After GST pull-down assay, the samples were subjected to silver staining according to the manufacturer's instructions and applied for mass-spectrometry. (c) GST-pull down analysis was performed and immunoblotted with the indicated antibodies (left). 293T cell lysates were immunoprecipitated with anti-HSP70 antibody (upper) or anti-CHIP antibody (bottom) and immunoblotting with anti-Ebp1 or anti-N-Ebp1 antibody (right) (d) knockdown experiment with si-HSP70. (e and f) Ubiquitinated p85 was detected by immunoblotting with anti-HA antibody from Flag-p85- and HA-Ub-transfected PC12 cells. To obtain similar amount of immunoprecipitated Flag-p85, we transfected 0.5 μg of GFP-p42 while we transfected 1 μg of control. (g) p85 levels were monitored after co-transfection with different combinations of Myc-p42, GST-CHIP or HSP70. (h) Endogenous p85 levels were determined from 293T cells silenced with SCR, si-Ebp1 or si-CHIP (upper). Densitometry analysis (bottom). **P<0.005 versus control. (i) Endogenous protein levels were examined in the mouse embryonic fibroblast (MEF) CHIP (−/−) or CHIP (+/+) cells against anti-p85, anti-Ebp, anti-CHIP or anti-β-actin antibodies. (j) MEF CHIP (−/−) or CHIP (+/+) cells were co-transfected with Flag-p85 and HA-ub along with GFP-p42 and then exposed to MG132 for 8 h. (k) CHIP (−/−) cells was transfected with Myc-CHIP with or without p42 and immunoblotting was performed as indicated. (l) PI3K activity assay with GFP-p42- or Myc-CHIP-transfected cell lysates. *P<0.05 and **P<0.005
Figure 6
Figure 6
The p42 represses tumorigenesis in vivo through downregulation of p85. (a and b) Endogenous protein levels were examined in the mouse brain of CHIP-KO or CHIP-WT by immunoblotting and immunohistochemistry. The paraffin blocks were stained with anti-CHIP, anti-p85 antibody. Arrows indicate stained cells. Scale bar: 40 μm. (c and d) U251 cells (5 × 10⁶) were injected subcutaneously into the nude mice. After tumor size reached 5 mm diameter, three groups of viral particles of AAV-GFP, AAV-p42 or AAV-p42 and AAV-CHIP were administrated to tumor region (as described in the Materials and Methods). After 21 days of AAV injection, animals were killed and their tumors were removed. Tumor volumes were measured from bi-dimensional measurements every 3 days and compared. The values shown are mean±S.E.M. **P<0.005 versus vector alone. Tumor weights were measured at 21 days after viral injection. Scale bar: 10 mm. (e) Representative tumor image of mice models were stained with hematoxylin and eosin (H&E, top). Proliferative cells were assessed by staining with an anti-PCNA antibody. Arrows indicate the PCNA-positive stained cells (middle). The expression level of p85 was stained with anti-p85 antibody. Arrows indicate p85-positive stained cells (bottom). Scale bar: 20 μm
Figure 7
Figure 7
Schematic diagram of the cell signal pathway that p42 utilizes to suppress tumor growth by controlling PI3K activity through UPS. As most of the tumor cells exhibit an extremely low level of p42 protein, p85 may not have had access to the HSP70/CHIP-mediated ubiquitination and degradation in tumors, allowing higher activation of PI3K. However, once p42 protein level is upregulated, p42 provides p85 to HSP70/CHIP complex for the degradation of p85 by interacting with p85 and HSP70/CHIP, thereby inhibiting PI3K activity

Similar articles

Cited by

References

    1. Ahn JY, Liu X, Liu Z, Pereira L, Cheng D, Peng J, et al. Nuclear Akt associates with PKC-phosphorylated Ebp1, preventing DNA fragmentation by inhibition of caspase-activated DNase. EMBO J. 2006;25:2083–2095. - PMC - PubMed
    1. Liu Z, Ahn JY, Liu X, Ye K. Ebp1 isoforms distinctively regulate cell survival and differentiation. Proc Natl Acad Sci USA. 2006;103:10917–10922. - PMC - PubMed
    1. Liu Z, Oh SM, Okada M, Liu X, Cheng D, Peng J, et al. Human BRE1 is an E3 ubiquitin ligase for Ebp1 tumor suppressor. Mol Biol Cell. 2009;20:757–768. - PMC - PubMed
    1. Monie TP, Perrin AJ, Birtley JR, Sweeney TR, Karakasiliotis I, Chaudhry Y, et al. Structural insights into the transcriptional and translational roles of Ebp1. EMBO J. 2007;26:3936–3944. - PMC - PubMed
    1. Zhang Y, Hamburger AW. Heregulin regulates the ability of the ErbB3-binding protein Ebp1 to bind E2F promoter elements and repress E2F-mediated transcription. J Biol Chem. 2004;279:26126–26133. - PubMed

Publication types

MeSH terms