. 2014 Mar 20;5(3):e1134.
doi: 10.1038/cddis.2014.98.

Overcoming inherent resistance to histone deacetylase inhibitors in multiple myeloma cells by targeting pathways integral to the actin cytoskeleton

Affiliations

Overcoming inherent resistance to histone deacetylase inhibitors in multiple myeloma cells by targeting pathways integral to the actin cytoskeleton

S Mithraprabhu et al. Cell Death Dis. .

Abstract

Histone deacetylase inhibitors (HDACi) are novel chemotherapeutics undergoing evaluation in clinical trials for the potential treatment of patients with multiple myeloma (MM). Although HDACi have demonstrable synergy when combined with proteasome inhibitors (PIs), recent evidence indicates that combination of HDACi and PI is beneficial only in a subset of patients with advanced MM, clearly indicating that other rational combinations should be explored. In this context we hypothesized that understanding the molecular signature associated with inherent resistance to HDACi would provide a basis for the identification of therapeutic combinations with improved clinical efficacy. Using human myeloma cell lines (HMCL) categorized as sensitive, intermediate or resistant to HDACi, gene expression profiling (GEP) and gene ontology enrichment analyses were performed to determine if a genetic signature associated with inherent resistance to HDACi-resistance could be identified. Correlation of GEP to increasing or decreasing sensitivity to HDACi indicated a unique 35-gene signature that was significantly enriched for two pathways - regulation of actin cytoskeleton and protein processing in endoplasmic reticulum. When HMCL and primary MM samples were treated with a combination of HDACi and agents targeting the signaling pathways integral to the actin cytoskeleton, synergistic cell death was observed in all instances, thus providing a rationale for combining these agents with HDACi for the treatment of MM to overcome resistance. This report validates a molecular approach for the identification of HDACi partner drugs and provides an experimental framework for the identification of novel therapeutic combinations for anti-MM treatment.


Figures
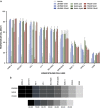
Figure 1
Figure 1
Determination of sensitivity of HMCL to HDACi LBH589, SAHA and FK228. (a) Nine HMCL were exposed to three doses of HDACi (LBH589 and FK228 at 10, 50 and 100 nM and SAHA at 1, 5 and 10 μM) for 48 h and the proportion of cell death determined through flow cytometric enumeration of propidium iodide staining. Cell death is normalized to proportion of cell death in untreated samples. Data are represented as mean±S.E.M. from three experiments. (b) Representation of cell death induced by LBH589 (100 nM), SAHA (10 μM) and FK228 (100 nM) in nine HMCL. Mean cell death induced by each HDACi is represented. Different shades represent the amount of cell death as shown in the boxes.
Figure 2
Figure 2
Genetic signature associated with resistance to HDACi. (a) VENN diagram of genes that are differentially regulated in the sensitive (SENS) versus resistant (RES), intermediate (IM) versus SENS and IM versus RES. Differential expression was defined as probes associated with P-values <0.05, and fold changes >1.5. (b) Unsupervised PCA of sensitive, intermediate and resistant cell lines indicating correlation of gene expression to HDACi responsiveness. Resistant HMCL (red) clustered together, whereas intermediate HMCL (green) had a profile closer to that of the sensitive HMCL (blue). (c) Heat map representation of the 97 genes differentially regulated between the SENS versus RES cell lines. Heat map also includes the expression profile of 97 genes in the intermediate cell lines indicating a GEP overlapping with both sensitive and resistant cell lines. (d) Eight genes were selected for validation of the Illumina HT-12 microarray. Column graphs show relative expression levels of the genes as mean±S.E.M. of sensitive (n=5), intermediate (n=2) and resistant (n=2) cell lines. GraphPad prism was utilized to determine significant differences between each cohort (*P<0.05, **P<0.01, ***P<0.001, ****P<0.0001)
Figure 3
Figure 3
A 35-probe signature correlates to grade of sensitivity to HDACi. (a) Probes were tested for their correlation to grade of sensitivity using Spearman rank algorithm. Correlation plot indicating greater than 80% positive or negative correlation of gene expression in resistant and intermediate compared with sensitive HMCL. (b) Heat map representation of 35 probes with increasing or decreasing gene expression levels in sensitive, intermediate and resistant HMCL. (c) Graph representing the enrichment score for pathways that the differentially regulated gene set was enriched for. A score >1 indicates an overexpression of the functional group, whereas a score >3 indicates a significant overexpression of the functional group. Genes associated with the regulation of actin cytoskeleton (P=0.03) and protein processing in endoplasmic reticulum (P=0.02) were significantly enriched in the gene set
Figure 4
Figure 4
Simplified representation of the regulation of actin cytoskeleton pathway and differentially regulated genes. Regulation of actin cytoskeleton encompasses signaling to the cytoskeleton through GPCRs, ITGs and growth factor (GF) – RTKs, leading to diverse cell functions including changes in cell motility, proliferation and survival., , , GPCR signaling is activated by a number of external stimuli and signals through heterotrimeric G-proteins, which in turn stimulates a variety of downstream signaling pathways including MAPK, PI3K, FAK and Rho family of GTPases (Rho, Rac and cell division cycle 42 – CDC42) and downstream protein kinase effectors including p21-activated kinase (PAK)., Within the 35-gene signature, F2R and OPN3, both GPCR proteins, were dysregulated. Regulators of G-protein signaling (RGS) are multifunctional signaling proteins that directly bind to activated G-proteins and are integral for modulation of the GPCR signaling process. RGS12, a RGS protein, is upregulated in the resistant cell lines. RTKs are high-affinity cell surface receptors for GF and are key regulators of normal cellular processes and progression of many types of cancers. Predominant signaling pathway that mediates signals from RTK-GF is the MAPK pathway. FAK and PI3K pathways are also known to have important roles in signal transduction. FGF9, a GF, is upregulated in the resistant cell lines. ITGs are a family of cell-surface-adhesion receptors that transmit signals to the cell to determine migration, survival, differentiation and motility in context with the GPCR and RTK-GF signaling. One of the first integrin signaling molecules to be activated is FAK, which in turn activates other signaling pathways. Signaling initiated by GPCR, RTK-GF or ITGs results in remodeling of the actin cytoskeleton and KIF4A, upregulated in resistant cell lines, is a known actin cytoskeleton protein. Genes upregulated in the resistant cell lines are shown in red, whereas downregulated genes are shown in blue
Figure 5
Figure 5
Targeting the actin cytoskeleton overcomes resistance to HDACi in HMCL. Graphs representing proportion of cell death induced in HMCL treated with a combination of HDACi – LBH589 (0, 5, 10 and 20 nM) and MEK/ERK (GSK1120212 or ARRY-162, at 0.5 and 1 μM, respectively), FAK inhibitors (TAE226 and PF50638, both at 0.5 μM) or PI3K inhibitors (GDC-0941 or BKM120, both at 0.5 μM) for 72 h estimated through flow cytometric enumeration of propidium iodide staining. (a) HDACi-resistant cell line U266 was treated with inhibitors (LBH589 at 0, 5, 10 and 20 nM) as above and proportion of cell death is shown. (b) HDACi-resistant cell line OPM2 was treated with inhibitors (LBH589 at 0, 1, 5 and 10 nM) as above and proportion of cell death is shown. (c) HDACi-intermediate cell line RPMI-8226 was treated with inhibitors (LBH589 at 0, 1, 5 and 10 nM) as above and proportion of cell death is shown. (d) HDACi-sensitive cell line OCI-MY1 was treated with inhibitors (LBH589 at 0, 1, 5 and 10 nM) as above and proportion of cell death is shown. Each point represents mean±S.E.M. of the proportion of cell death from three individual experiments. Synergistic combinations were determined through two-way ANOVA analysis and significances are as indicated (αP<0.05, LBH589 versus LBH589+GSK1120212; βP<0.05, LBH589 versus LBH589+ARRY-162; χP<0.05, LBH589 versus LBH589+TAE226; δP<0.05, LBH589 versus LBH589+PF50638; ɛP<0.05, LBH589 versus LBH589+GDC-0941, φP<0.05, LBH589 versus LBH589+BKM120)
Figure 6
Figure 6
Targeting the actin cytoskeleton overcomes resistance to HDACi in primary MM. (a) Graphs representing the proportion of cell death induced in MM patients (n=6) treated with HDACi – LBH589 (5 nM), GSK1120212 (0.5 μM) and combination. (b) Graphs representing the proportion of cell death induced in MM patients (n=6) treated LBH589 (5 nM), TAE226 (0.5 μM) and combination. (c) Graphs representing the proportion of cell death induced in MM patients (n=6) treated with LBH589 (5 nM), BKM120 (0.5 μM) and combination for 72 h. Cell death was estimated through flow cytometric enumeration of APO2.7 staining in CD38+ and CD45− MM cells. Numbers on top of the bars representing cell death proportion in the drug combination samples represent the SQ of the stated combinations. SQ of >1 represents a synergistic combination

Similar articles

Cited by

References

    1. Chapman MA, Lawrence MS, Keats JJ, Cibulskis K, Sougnez C, Schinzel AC, et al. Initial genome sequencing and analysis of multiple myeloma. Nature. 2011;471:467–472. - PMC - PubMed
    1. Greipp PR, San Miguel J, Durie BG, Crowley JJ, Barlogie B, Blade J, et al. International staging system for multiple myeloma. J Clin Oncol. 2005;23:3412–3420. - PubMed
    1. Hideshima T, Bradner JE, Wong J, Chauhan D, Richardson P, Schreiber SL, et al. Small-molecule inhibition of proteasome and aggresome function induces synergistic antitumor activity in multiple myeloma. Proc Natl Acad Sci USA. 2005;102:8567–8572. - PMC - PubMed
    1. Hideshima T, Richardson PG, Anderson KC. Mechanism of action of proteasome inhibitors and deacetylase inhibitors and the biological basis of synergy in multiple myeloma. Mol Cancer Ther. 2011;10:2034–2042. - PMC - PubMed
    1. Siegel DS, Dimopoulos MA, Yoon SS, Laubach JP, Kaufman JL, Goldschmidt H, et al. Vantage 095: vorinostat in combination with bortezomib in salvage multiple myeloma patients: final study results of a global phase 2b trial. Blood. 2011;118:223–224. - PubMed

Publication types

MeSH terms

Substances