Differences between the cell populations from the peritenon and the tendon core with regard to their potential implication in tendon repair
- PMID: 24651449
- PMCID: PMC3961373
- DOI: 10.1371/journal.pone.0092474
Differences between the cell populations from the peritenon and the tendon core with regard to their potential implication in tendon repair
Abstract
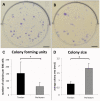
The role of intrinsic and extrinsic healing in injured tendons is still debated. In this study, we characterized cell plasticity, proliferative capacity, and migration characteristics as proxy measures of healing potential in cells derived from the peritenon (extrinsic healing) and compared these to cells from the tendon core (intrinsic healing). Both cell populations were extracted from horse superficial digital flexor tendon and characterized for tenogenic and matrix remodeling markers as well as for rates of migration and replication. Furthermore, colony-forming unit assays, multipotency assays, and real-time quantitative polymerase chain reaction analyses of markers of osteogenic and adipogenic differentiation after culture in induction media were performed. Finally, cellular capacity for differentiation towards a myofibroblastic phenotype was assessed. Our results demonstrate that both tendon- and peritenon-derived cell populations are capable of adipogenic and osteogenic differentiation, with higher expression of progenitor cell markers in peritenon cells. Cells from the peritenon also migrated faster, replicate more quickly, and show higher differentiation potential toward a myofibroblastic phenotype when compared to cells from the tendon core. Based on these data, we suggest that cells from the peritenon have substantial potential to influence tendon-healing outcome, warranting further scrutiny of their role.
Conflict of interest statement
Figures


Similar articles
-
Regional differences in stem cell/progenitor cell populations from the mouse achilles tendon.Tissue Eng Part A. 2013 Jan;19(1-2):199-210. doi: 10.1089/ten.TEA.2012.0182. Epub 2012 Sep 14. Tissue Eng Part A. 2013. PMID: 22871316 Free PMC article.
-
Tendon proper- and peritenon-derived progenitor cells have unique tenogenic properties.Stem Cell Res Ther. 2014 Jul 8;5(4):86. doi: 10.1186/scrt475. Stem Cell Res Ther. 2014. PMID: 25005797 Free PMC article.
-
Examining the Effects of In Vitro Co-Culture of Equine Adipose-Derived Mesenchymal Stem Cells With Tendon Proper and Peritenon Cells.J Equine Vet Sci. 2023 Jul;126:104262. doi: 10.1016/j.jevs.2023.104262. Epub 2023 Feb 24. J Equine Vet Sci. 2023. PMID: 36841345
-
Tenogenic differentiation of stem cells for tendon repair-what is the current evidence?J Tissue Eng Regen Med. 2011 Aug;5(8):e144-63. doi: 10.1002/term.424. Epub 2011 May 5. J Tissue Eng Regen Med. 2011. PMID: 21548133 Review.
-
Assessment of stem cell carriers for tendon tissue engineering in pre-clinical models.Stem Cell Res Ther. 2014;5(2):38. doi: 10.1186/scrt426. Stem Cell Res Ther. 2014. PMID: 25157898 Free PMC article. Review.
Cited by
-
The Evaluation of Equine Allogeneic Tenogenic Primed Mesenchymal Stem Cells in a Surgically Induced Superficial Digital Flexor Tendon Lesion Model.Front Vet Sci. 2021 Mar 5;8:641441. doi: 10.3389/fvets.2021.641441. eCollection 2021. Front Vet Sci. 2021. PMID: 33748217 Free PMC article.
-
Tendon Stem/Progenitor Cell Subpopulations and Their Implications in Tendon Biology.Front Cell Dev Biol. 2021 Feb 18;9:631272. doi: 10.3389/fcell.2021.631272. eCollection 2021. Front Cell Dev Biol. 2021. PMID: 33681210 Free PMC article.
-
GM1 Ganglioside Promotes Osteogenic Differentiation of Human Tendon Stem Cells.Stem Cells Int. 2018 Aug 23;2018:4706943. doi: 10.1155/2018/4706943. eCollection 2018. Stem Cells Int. 2018. PMID: 30210549 Free PMC article.
-
AMP-activated protein kinase (AMPK) is essential for tendon homeostasis and prevents premature senescence and ectopic calcification.bioRxiv [Preprint]. 2025 Apr 9:2025.01.31.635920. doi: 10.1101/2025.01.31.635920. bioRxiv. 2025. PMID: 39975248 Free PMC article. Preprint.
-
Characterization of the structure, vascularity, and stem/progenitor cell populations in porcine Achilles tendon (PAT).Cell Tissue Res. 2021 May;384(2):367-387. doi: 10.1007/s00441-020-03379-3. Epub 2021 Jan 26. Cell Tissue Res. 2021. PMID: 33496880 Free PMC article.
References
-
- Pierre-Jerome C, Moncayo V, Terk MR (2010) MRI of the Achilles tendon: a comprehensive review of the anatomy, biomechanics, and imaging of overuse tendinopathies. Acta Radiol 51: 438–454. - PubMed
-
- Rees JD, Maffulli N, Cook J (2009) Management of tendinopathy. Am J Sports Med 37: 1855–1867. - PubMed
-
- Skoog T, Persson BH (1954) An experimental study of the early healing of tendons. Plast Reconstr Surg (1946) 13: 384–399. - PubMed
-
- Potenza AD (1964) Prevention of Adhesions to Healing Digital Flexor Tendons. Jama 187: 187–191. - PubMed
Publication types
MeSH terms
Substances
LinkOut - more resources
Full Text Sources
Other Literature Sources

