

Dynamics of the force of infection: insights from Echinococcus multilocularis infection in foxes
- PMID: 24651596
- PMCID: PMC3961194
- DOI: 10.1371/journal.pntd.0002731
Dynamics of the force of infection: insights from Echinococcus multilocularis infection in foxes
Abstract
Characterizing the force of infection (FOI) is an essential part of planning cost effective control strategies for zoonotic diseases. Echinococcus multilocularis is the causative agent of alveolar echinococcosis in humans, a serious disease with a high fatality rate and an increasing global spread. Red foxes are high prevalence hosts of E. multilocularis. Through a mathematical modelling approach, using field data collected from in and around the city of Zurich, Switzerland, we find compelling evidence that the FOI is periodic with highly variable amplitude, and, while this amplitude is similar across habitat types, the mean FOI differs markedly between urban and periurban habitats suggesting a considerable risk differential. The FOI, during an annual cycle, ranges from (0.1,0.8) insults (95% CI) in urban habitat in the summer to (9.4, 9.7) (95% CI) in periurban (rural) habitat in winter. Such large temporal and spatial variations in FOI suggest that control strategies are optimal when tailored to local FOI dynamics.
Conflict of interest statement
The authors have declared that no competing interests exist.
Figures
 ,
,  ,
,  and
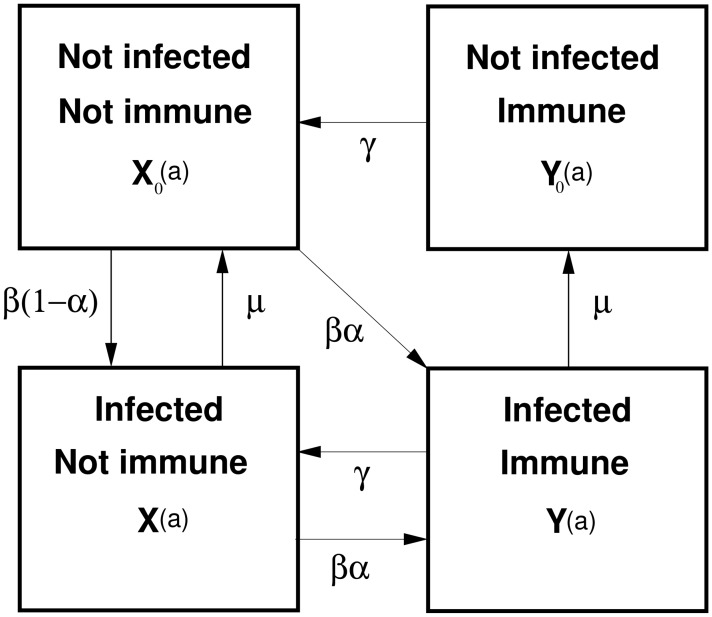
and  , where
  represents the proportion of hosts (foxes) which are not infected and not immune at age
  , the other state variables are similarly defined. Parameter
  denotes the infection pressure (force of infection), measured in insults (exposures) per year;
  is the probability of immunity on exposure;
  is the rate of loss of host immunity;
  is the parasite death rate.
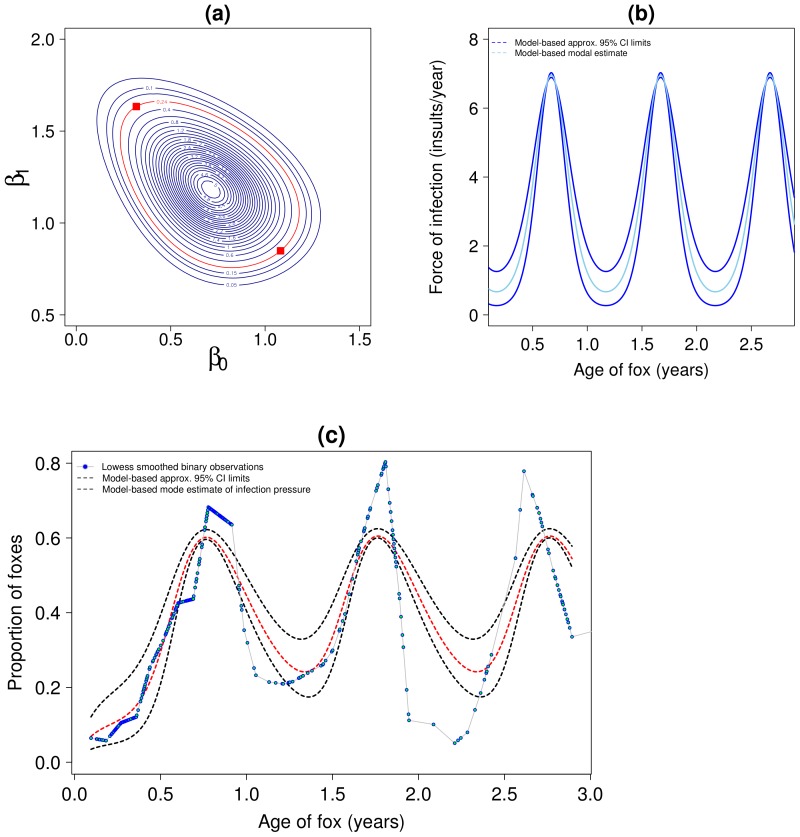
 on log scale. The red contour is the 95% limit and the two points marked are those used to produce approx. 95% confidence intervals in panels b and c. Panel (b): dynamics of force of infection by age, 95% CI is for the mean force of infection at age
  . Panel (c): Smoothed observed prevalence and prevalence predicted by Model 1-P, 95% CI are for the mean prevalence at age
  . All results use the informative prior for
  with mean = 1.2 and sd = 0.2.
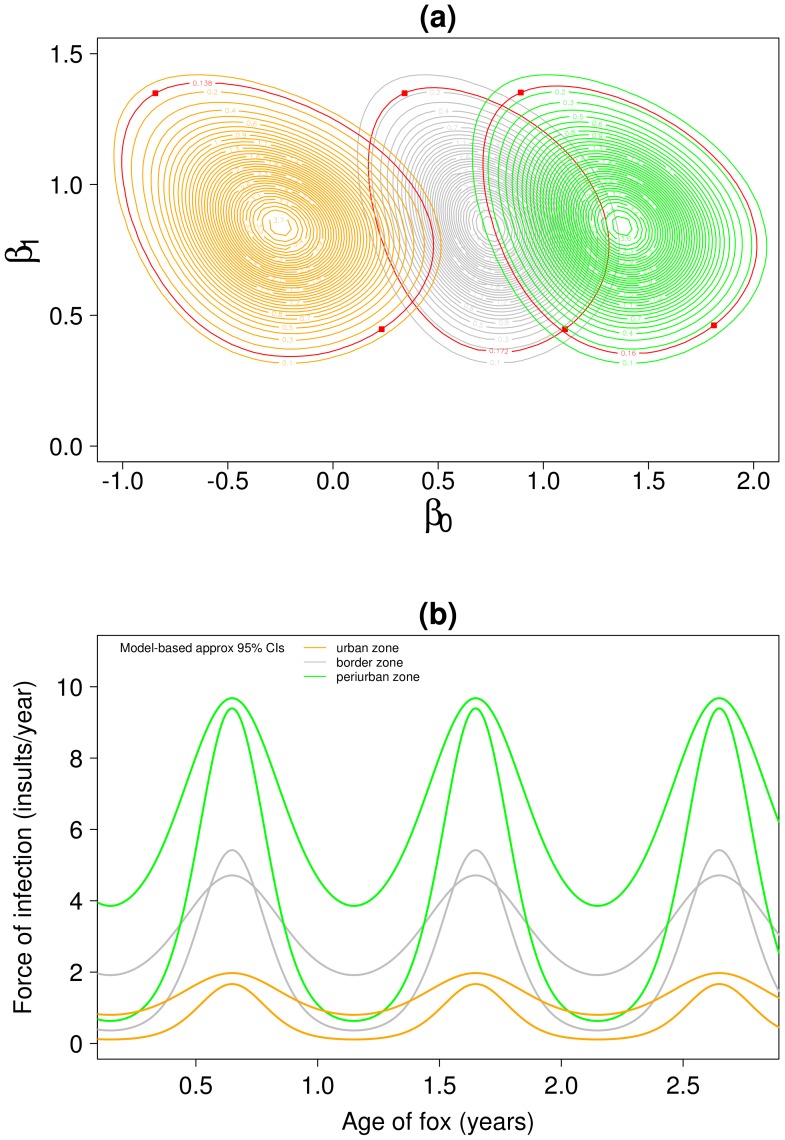
 ,
,  ,
,  on log scale. The red contour is the 95% limit and the two points marked are those used to produce approx. 95% confidence intervals in panel b. Panel (b): dynamics of force of infection by age, approx 95% CI is for the mean force of infection at age
  (see main text for explanation of why these lines cross). All results use the informative prior for
  with mean = 1.2 and sd = 0.2.
References
-
- Anderson R, May R (1992) Infectious Diseases of Humans: Dynamics and Control. New York, USA: Oxford Science Publications, Oxford University Press.
-
- Mueller I, Schoepin S, Smith TA, Benton KL, Bretscher MT, et al. (2012) Force of infection is key to understanding the epidemiology of Plasmodium falciparum Malaria in Papua New Guinean children. Proceedings of the National Academy of Sciences of the United States of America 109: 10030–10035. - PMC - PubMed
-
- Budke CM, Jiamin Q, Craig PS, Torgerson PR (2005) Modeling the transmission of Echinococ-cus granulosus and Echinococcus multilocularis in dogs for a high endemic region of the Tibetan plateau. International Journal For Parasitology 35: 163–170. - PubMed
Publication types
MeSH terms
LinkOut - more resources
Full Text Sources
Other Literature Sources
Medical
