

Effects of halving pesticide use on wheat production
- PMID: 24651597
- PMCID: PMC3960944
- DOI: 10.1038/srep04405
Effects of halving pesticide use on wheat production
Abstract
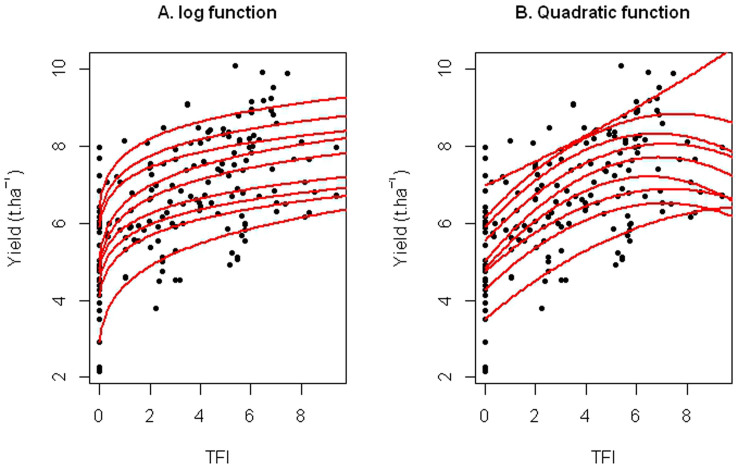
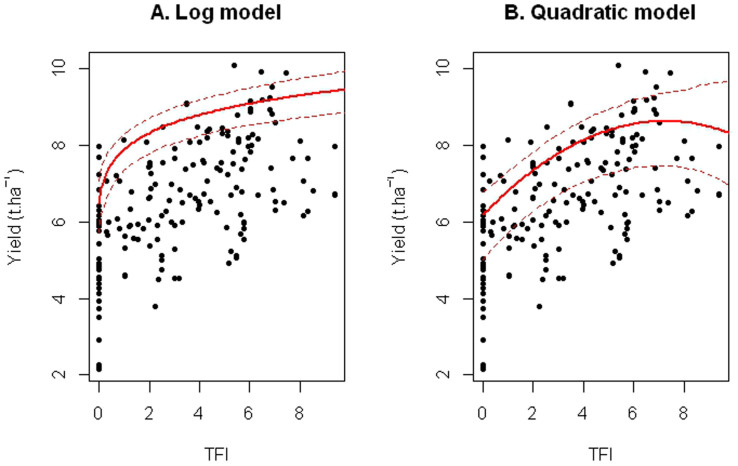
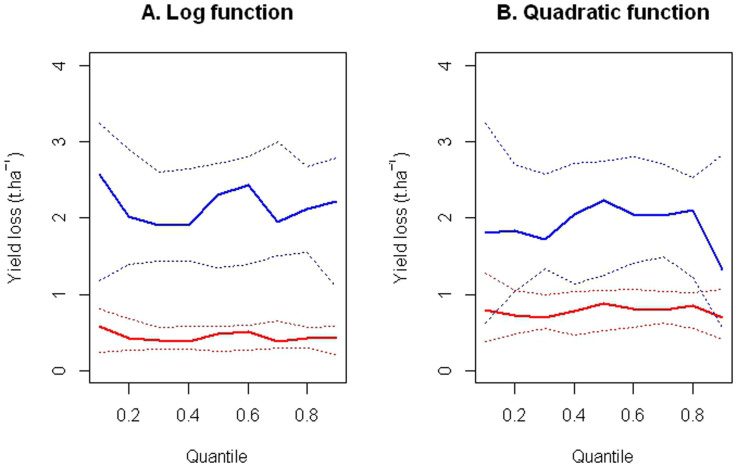
Pesticides pose serious threats to both human health and the environment. In Europe, farmers are encouraged to reduce their use, and in France a recent environmental policy fixed a target of halving the pesticide use by 2018. Organic and integrated cropping systems have been proposed as possible solutions for reducing pesticide use, but the effect of reducing pesticide use on crop yield remains unclear. Here we use a set of cropping system experiments to quantify the yield losses resulting from a reduction of pesticide use for winter wheat in France. Our estimated yield losses resulting from a 50% reduction in pesticide use ranged from 5 to 13% of the yield obtained with the current pesticide use. At the scale of the whole country, these losses would decrease the French wheat production by about 2 to 3 millions of tons, which represent about 15% of the French wheat export.
Figures
References
-
- Food and Agriculture Organization of the United Nations (FAOSTAT). FAO Statistical Databases, http://faostat.fao.org/site/567/default.aspx (accessed, October 2013).
-
- Foley J. A. et al. Solutions for a cultivated planet. Nature. 478, 337–342 (2011). - PubMed
-
- Enserink M., Hines P. J., Vignieri S. N., Wigginton N. S. & Yeston J. S. The pesticide paradox. Science. 341, 729 (2013). - PubMed
-
- Elbaz A. et al. Professional exposure to pesticides and Parkinson disease. Ann Neurol. 66, 494–504 (2009). - PubMed
-
- National Institute of Health and Medical Research in France (Inserm). Pesticides, effets sur la santé. Expertise collective, Synthèse et recommendations. http://www.inserm.fr/actualites/rubriques/actualites-societe/pesticides-... (accessed, June 2013).
MeSH terms
Substances
LinkOut - more resources
Full Text Sources
Other Literature Sources
Medical
