. 2014 Mar 20;10(3):e1004023.
doi: 10.1371/journal.ppat.1004023. eCollection 2014 Mar.

A compact, multifunctional fusion module directs cholesterol-dependent homomultimerization and syncytiogenic efficiency of reovirus p10 FAST proteins

Affiliations

A compact, multifunctional fusion module directs cholesterol-dependent homomultimerization and syncytiogenic efficiency of reovirus p10 FAST proteins

Tim Key et al. PLoS Pathog. .

Abstract

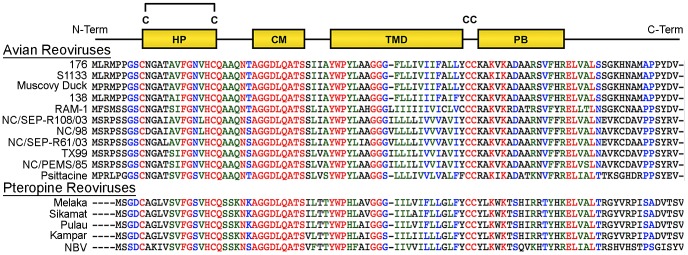
The homologous p10 fusion-associated small transmembrane (FAST) proteins of the avian (ARV) and Nelson Bay (NBV) reoviruses are the smallest known viral membrane fusion proteins, and are virulence determinants of the fusogenic reoviruses. The small size of FAST proteins is incompatible with the paradigmatic membrane fusion pathway proposed for enveloped viral fusion proteins. Understanding how these diminutive viral fusogens mediate the complex process of membrane fusion is therefore of considerable interest, from both the pathogenesis and mechanism-of-action perspectives. Using chimeric ARV/NBV p10 constructs, the 36-40-residue ectodomain was identified as the major determinant of the differing fusion efficiencies of these homologous p10 proteins. Extensive mutagenic analysis determined the ectodomain comprises two distinct, essential functional motifs. Syncytiogenesis assays, thiol-specific surface biotinylation, and liposome lipid mixing assays identified an ∼25-residue, N-terminal motif that dictates formation of a cystine loop fusion peptide in both ARV and NBV p10. Surface immunofluorescence staining, FRET analysis and cholesterol depletion/repletion studies determined the cystine loop motif is connected through a two-residue linker to a 13-residue membrane-proximal ectodomain region (MPER). The MPER constitutes a second, independent motif governing reversible, cholesterol-dependent assembly of p10 multimers in the plasma membrane. Results further indicate that: (1) ARV and NBV homomultimers segregate to distinct, cholesterol-dependent microdomains in the plasma membrane; (2) p10 homomultimerization and cholesterol-dependent microdomain localization are co-dependent; and (3) the four juxtamembrane MPER residues present in the multimerization motif dictate species-specific microdomain association and homomultimerization. The p10 ectodomain therefore constitutes a remarkably compact, multifunctional fusion module that directs syncytiogenic efficiency and species-specific assembly of p10 homomultimers into cholesterol-dependent fusion platforms in the plasma membrane.


Conflict of interest statement

The authors have declared that no competing interests exist.

Figures

Figure 1
Figure 1. Sequence and motif conservation in avian and pteropine reovirus p10 FAST proteins.
Sequences of representative isolates of avian and pteropine p10 clades are shown, color coded to indicate the degree of conservation: red, absolutely conserved; blue, highly conserved; green, moderately conserved; black, not conserved. The diagram at the top depicts locations of motifs present in the ectodomain (HP, hydrophobic patch; CM, conserved motif) and endodomain (PB, polybasic) flanking the central transmembrane domain (TMD). The four conserved cysteine residues (C) are shown; the di-cysteine motif in the endodomain is palmitoylated while the two cysteines in the ectodomain form an intra-molecular di-sulfide bond.
Figure 2
Figure 2. The p10 ectodomains are major determinants of syncytiogenic efficiency and lipid mixing activity.
(A) The ecto-, TM and endodomains of ARV (red) and NBV (blue) p10 were permutationally exchanged, using sequential PCR reactions, to create six chimeric p10 constructs named as indicated. (B) Surface expression levels (top) measured by flow cytometry, and total steady-state expression levels (bottom) detected by western blotting, of N-terminally FLAG-tagged versions of the parental p10 and chimeric p10 constructs. Lanes in the western blot were spliced together from a single blot. Surface expression levels are presented as mean ± SEM (n = 3) (C) Syncytial nuclei present in five random fields of Giemsa stained monolayers were counted at indicated times post-transfection for chimeric ecto (top), TM (middle) and endodomain (bottom) p10 constructs in transfected QM5 cell monolayers. Results are mean ± SEM (n = 3). Syncytiogenesis induced by parental ARV and NBV p10 (see Figure S1) are shown in watermark on each graph. (D) Fluorescence resonance energy transfer was used to monitor the extent of lipid mixing induced by 5 µM and 10 µM ARV (red) and NBV (blue) ectodomain synthetic peptides incubated with 100 µM LUVs composed of DOPC-DOPE-cholesterol-sphingomyelin (40∶20∶20∶20). The same assay was performed using buffer instead of peptide (control, black).
Figure 3
Figure 3. A distinct N-terminal ectodomain motif governs species-specific formation of an essential intramolecular disulfide-bond formation.
(A) Ectodomain segments were exchanged between ARV and NBV p10 to create ten chimeric constructs (A/N 1–5). Thin red lines and thick blue lines denote ARV and NBV sequences, respectively. Amino acid sequences of ARV and NBV are shown at the top and bottom, respectively. Background grey boxes denote conserved amino acids. Locations of the HP and CM are indicated above. (B) Syncytium formation induced by each construct in transfected QM5 cells, as determined in Figure 2C, presented as mean ± SEM (n = 3). (C) N-terminally FLAG-tagged versions of the indicated chimeric ectodomain constructs were transfected into QM5 monolayers and at 24 h post-transfection, cells were incubated in HBSS with or without 0.1 mM DTT prior to treatment with membrane-impermeable maleimide-PEG2-biotin to detect free thiol groups in the p10 ectodomain. Biotinylated proteins were isolated using neutravidin beads and detected by western blotting using FLAG-specific antiserum.
Figure 4
Figure 4. Ectodomain-mediated homotypic clustering of p10 in the plasma membrane is cholesterol-dependent.
(A) QM5 cells co-transfected with N-terminally FLAG-tagged ARV p10 and N-terminally myc-tagged NBV p10 were fixed without permeabilization, and surface-localized ARV and NBV p10 detected using mouse-α-FLAG and rabbit-α-myc antisera, respectively. Bound antibodies were detected with Alexa Fluor 488 goat-α-mouse (green) and Alexa Fluor 647 goat-α-rabbit (red), and superposed in the merged image. (B) As in panel A, except cells were co-transfected with N-terminally FLAG-tagged ARV (top row) or NBV (bottom row) p10 and the indicated N-terminally myc-tagged chimeric constructs. (C) As in panel A, except cells were co-transfected with N-terminally FLAG-tagged ARV or NBV p10 and N-terminally myc-tagged versions of the indicated ectodomain chimeras. D) QM5 cell monolayers co-transfected with N-terminally FLAG-tagged ARV p10 and N-terminally myc-tagged NBV p10 were incubated with 20 mM MβCD for 20 min to deplete membrane cholesterol. Cells were then either fixed or cholesterol was repleted by treatment with MβCD-cholesterol complexes for 30 min prior to fixation. Cells were fixed and stained as in panel A. Scale bars = 10 µm. Insets are 400% enlargements of the indicated areas.
Figure 5
Figure 5. CM and neck region residues are essential for p10 clustering in plasma membranes and neck region residues determine species-specific p10 homotypic clustering.
(A) In the context of ARV p10, each non-Ala/Gly CM residue was substituted to either Ala or a conserved amino acid, while each Ala/Gly residue was substituted to the obverse. Constructs are named at left according to the substitution. The tetra-peptide neck residues were substituted to Ala in the context of both ARV (A-neck) and NBV (N-neck) p10. Syncytiogenic activity and cell surface expression levels (+ indicates no significant difference relative to the parental p10 construct) are summarized at right. (B) Representative immunofluorescence images of QM5 cells expressing N-terminally FLAG-tagged ARV p10 or N-terminally myc-tagged ARV p10 containing substitutions in the CM (D31E and T35A), or the A-neck construct, stained as in Figure 4. (C) N-terminally FLAG-tagged versions of the indicated point substitution constructs were subjected to the surface biotinylation assay to detect formation of the intramolecular disulfide bond as in Figure 3C. (D) Summary table of colocalization results obtained from co-transfections of QM5 cells with N-terminally FLAG-tagged versions of ARV or NBV p10 and the indicated N-terminally myc-tagged p10 ectodomain chimeras, listed in Figure 3. (E) Representative images of QM5 cells co-expressing N-terminally FLAG-tagged ARV or NBV p10 and N-terminally myc-tagged chimeric neck constructs (A5 and N5 from Figure 3). Cell surface-localized p10 was detected by immunofluorescence microscopy as in Figure 4, and merged images are shown. For all images, scale bars = 10 µm and insets are 400% enlargements of the indicated areas.
Figure 6
Figure 6. Effects of p10 chimeras and point substitutions on fusion activity of parental p10.
(A) Syncytium formation in QM5 cells co-transfected with ARV or NBV p10 and the indicated co-transfectants or empty vector (vec) was quantified at 24 h post-transfection as described in Figure 2C, and results are presented as mean ± SEM (n = 3). Co-transfectants included CM point substitutions (D31E and T35A), chimeric neck constructs (A5 and N5), and Ala substitutions of the tetra-peptide neck residues (A-neck and N-neck), as depicted in Figure 5. (B) As in panel A, except cells were co-transfected with ARV or NBV p10 and the ARV p10 C9S substitution, or with NBV p10 and the C9S substitution in an A5 background. Results are presented as mean ± SEM (n = 3). (C) Co-transfections with varying ratios of functional NBV p10 (f) and non-functional ARV C9S with the A5 substitution. Data is presented as mean ± SEM (n = 3).
Figure 7
Figure 7. ARV and NBV p10 proteins form homo- but not heteromultimers.
(A) Representative images of sensitized emission FRET, showing the donor and acceptor channels, and the calculated normalized FRET (NFRET) image. Control images were obtained from cells expressing EGFP directly linked to mCherry (GFP-mCh) or ARV p10-EGFP cotransfected with free mCherry (ARV-GFP+mCh) as negative FRET controls, or from cells co-expressing p14 FAST proteins linked to EGFP and mCherry as positive FRET controls for a known, multimeric membrane protein. Images acquired from cells co-expressing EGFP- and mCherry-tagged ARV p10 constructs (ARV-GFP+ARV-mCh) were used to detect ARV p10 multimerization. NFRET range is denoted by color gradations. Scale bars = 10 µm. (B) Fitted Gaussian distributions of twenty calculated NFRET images from two separate experiments were used to calculate the mNFRET (top) and mean pixel amplitude (bottom) from cells transfected or co-transfected with the indicated fluorescent probes. Boxes indicate mNFRET standard deviations, + denotes mean mNFRET, lines are the median mNFRET, and whiskers indicate min and max mNFRETs. Error bars in pixel amplitude panel represent standard error propagated within and across experiments.
Figure 8
Figure 8. The CM and neck region are both required for p10 multimerization but the neck region alone determines multimer specificity in a cholesterol-dependent manner.
(A) Cells co-expressing indicated EGFP and mCherry-tagged constructs with point substitutions in the CM (D31E or T35A), Ala substitutions of the neck tetra-peptide (A-neck or N-neck), and chimeric neck constructs (A5 or N5) were imaged to measure sensitized emission FRET. NFRET values are presented as in Figure 7. (B) Sensitized emission FRET of cells co-expressing EGFP- and mCherry-tagged ARV p10 constructs were imaged after treatment with MβCD. Cells were similarly depleted of cholesterol using MβCD, then repleted using cholesterol-loaded MβCD before imaging. NFRET values are presented as in Figure 7.

Similar articles

Cited by

References

    1. Woolhouse ME, Howey R, Gaunt E, Reilly L, Chase-Topping M, et al. (2008) Temporal trends in the discovery of human viruses. Proc Biol Sci 275: 2111–2115. - PMC - PubMed
    1. Chua KB, Bellini WJ, Rota PA, Harcourt BH, Tamin A, et al. (2000) Nipah virus: a recently emergent deadly paramyxovirus. Science 288: 1432–1435. - PubMed
    1. Halpin K, Young PL, Field HE, Mackenzie JS (2000) Isolation of Hendra virus from pteropid bats: a natural reservoir of Hendra virus. J Gen Virol 81: 1927–1932. - PubMed
    1. Li W, Shi Z, Yu M, Ren W, Smith C, et al. (2005) Bats are natural reservoirs of SARS-like coronaviruses. Science 310: 676–679. - PubMed
    1. Wong S, Lau S, Woo P, Yuen K-Y (2007) Bats as a continuing source of emerging infections in humans. Rev Med Virol 17: 67–91. - PMC - PubMed

Publication types

LinkOut - more resources