

A forward phenotypically driven unbiased genetic analysis of host genes that moderate herpes simplex virus virulence and stromal keratitis in mice
- PMID: 24651695
- PMCID: PMC3961320
- DOI: 10.1371/journal.pone.0092342
A forward phenotypically driven unbiased genetic analysis of host genes that moderate herpes simplex virus virulence and stromal keratitis in mice
Abstract
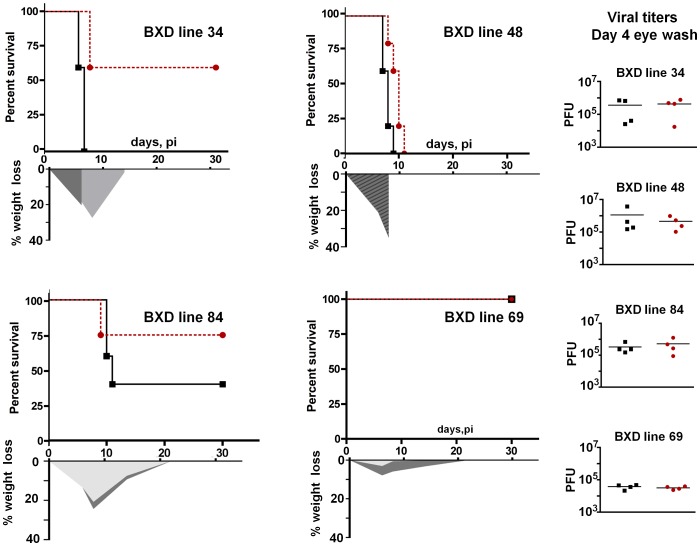
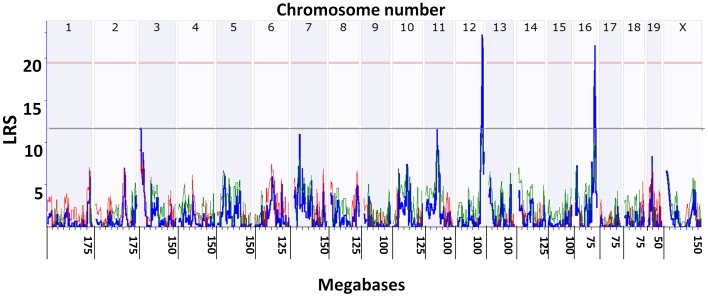
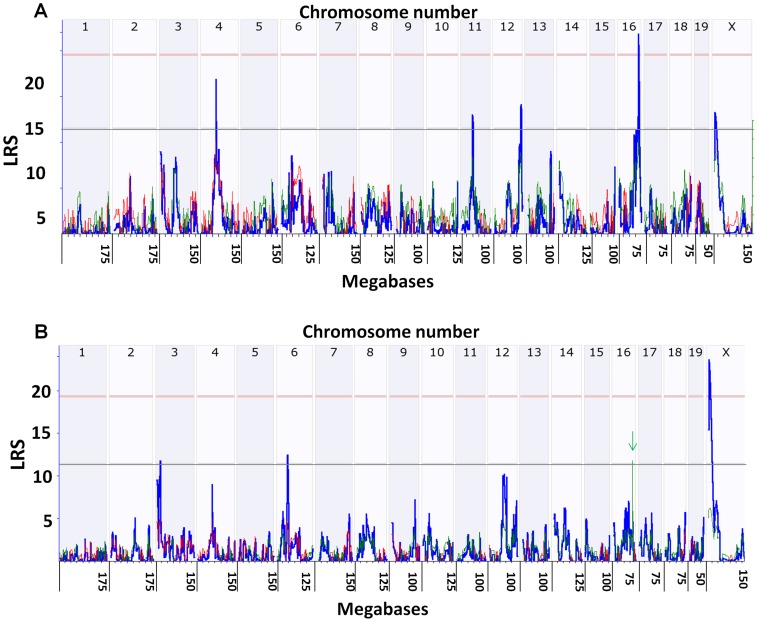
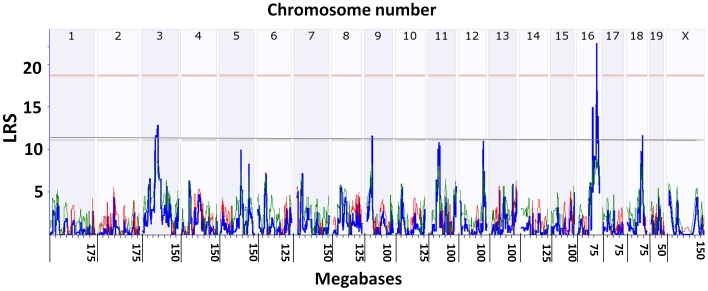
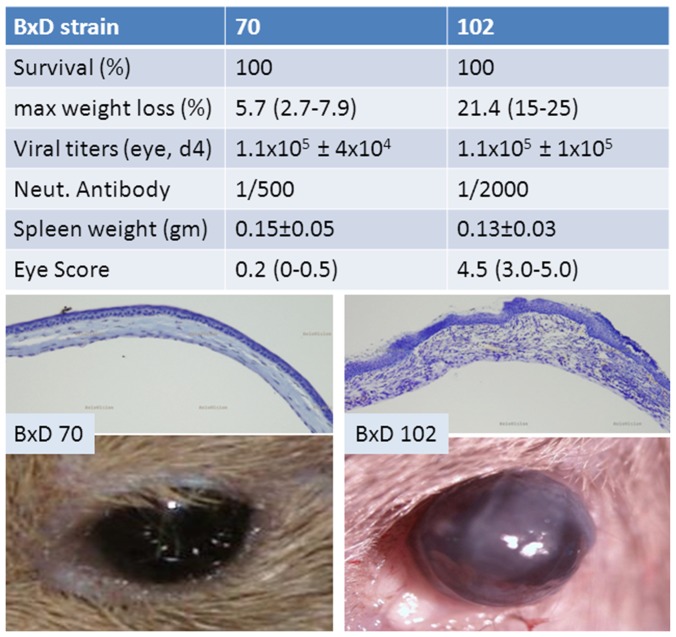
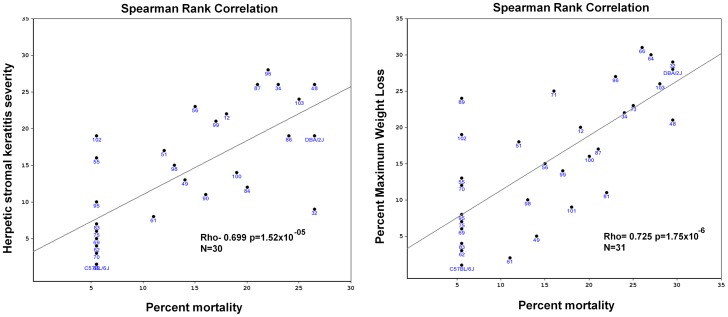
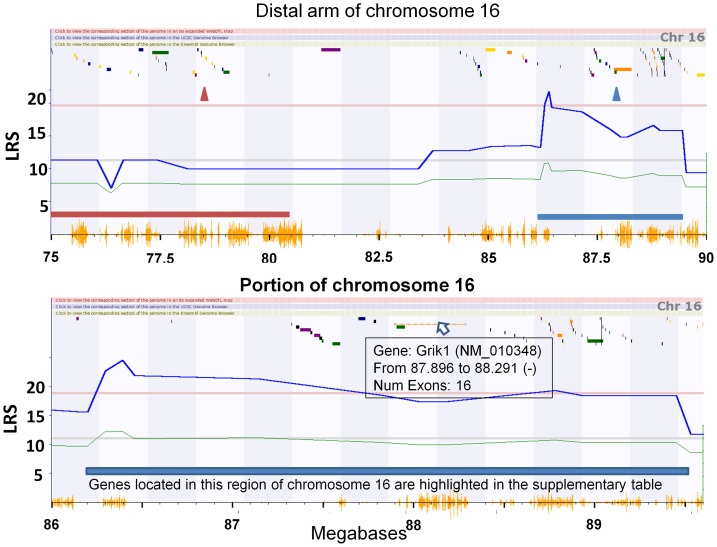
Both viral and host genetics affect the outcome of herpes simplex virus type 1 (HSV-1) infection in humans and experimental models. Little is known about specific host gene variants and molecular networks that influence herpetic disease progression, severity, and episodic reactivation. To identify such host gene variants we have initiated a forward genetic analysis using the expanded family of BXD strains, all derived from crosses between C57BL/6J and DBA/2J strains of mice. One parent is highly resistant and one highly susceptible to HSV-1. Both strains have also been fully sequenced, greatly facilitating the search for genetic modifiers that contribute to differences in HSV-1 infection. We monitored diverse disease phenotypes following infection with HSV-1 strain 17syn+ including percent mortality (herpes simplex encephalitis, HSE), body weight loss, severity of herpetic stromal keratitis (HSK), spleen weight, serum neutralizing antibody titers, and viral titers in tear films in BXD strains. A significant quantitative trait locus (QTL) on chromosome (Chr) 16 was found to associate with both percent mortality and HSK severity. Importantly, this QTL maps close to a human QTL and the gene proposed to be associated with the frequency of recurrent herpetic labialis (cold sores). This suggests that a single host locus may influence these seemingly diverse HSV-1 pathogenic phenotypes by as yet unknown mechanisms. Additional suggestive QTLs for percent mortality were identified--one on Chr X that is epistatically associated with that on Chr 16. As would be anticipated the Chr 16 QTL also modulated weight loss, reaching significance in females. A second significant QTL for maximum weight loss in male and female mice was mapped to Chr 12. To our knowledge this is the first report of a host genetic locus that modulates the severity of both herpetic disease in the nervous system and herpetic stromal keratitis.
Conflict of interest statement
Figures
Similar articles
-
Increased severity of herpes simplex virus type 1-induced keratitis in Hox A5 transgenic mice.Curr Eye Res. 2001 Dec;23(6):435-42. doi: 10.1076/ceyr.23.6.435.6970. Curr Eye Res. 2001. PMID: 12045893
-
The role of viral and host genes in corneal infection with herpes simplex virus type 1.Exp Eye Res. 2005 May;80(5):607-21. doi: 10.1016/j.exer.2004.09.007. Exp Eye Res. 2005. PMID: 15862167 Review.
-
Herpes simplex virus-specific T cells infiltrate the cornea of patients with herpetic stromal keratitis: no evidence for autoreactive T cells.Invest Ophthalmol Vis Sci. 2000 Aug;41(9):2607-12. Invest Ophthalmol Vis Sci. 2000. PMID: 10937573
-
[Herpes simplex virus latency, reactivation, and a new antiviral therapy for herpetic keratitis].Nippon Ganka Gakkai Zasshi. 2008 Mar;112(3):247-64; discussion 265. Nippon Ganka Gakkai Zasshi. 2008. PMID: 18411713 Review. Japanese.
-
Herpes simplex epithelial and stromal keratitis: an epidemiologic update.Surv Ophthalmol. 2012 Sep;57(5):448-62. doi: 10.1016/j.survophthal.2012.01.005. Epub 2012 Apr 28. Surv Ophthalmol. 2012. PMID: 22542912 Free PMC article. Review.
Cited by
-
Disease parameters following ocular herpes simplex virus type 1 infection are similar in male and female BALB/C mice.PLoS One. 2023 Jun 15;18(6):e0287194. doi: 10.1371/journal.pone.0287194. eCollection 2023. PLoS One. 2023. PMID: 37319284 Free PMC article.
-
HSV-1 clinical isolates with unique in vivo and in vitro phenotypes and insight into genomic differences.J Neurovirol. 2017 Apr;23(2):171-185. doi: 10.1007/s13365-016-0485-9. Epub 2016 Oct 13. J Neurovirol. 2017. PMID: 27739035
-
Mapping Murine Corneal Neovascularization and Weight Loss Virulence Determinants in the Herpes Simplex Virus 1 Genome and the Detection of an Epistatic Interaction between the UL and IRS/US Regions.J Virol. 2016 Aug 26;90(18):8115-31. doi: 10.1128/JVI.00821-16. Print 2016 Sep 15. J Virol. 2016. PMID: 27384650 Free PMC article.
-
Cold sore susceptibility gene-1 genotypes affect the expression of herpes labialis in unrelated human subjects.Hum Genome Var. 2014 Nov 20;1:14024. doi: 10.1038/hgv.2014.24. eCollection 2014. Hum Genome Var. 2014. PMID: 27081513 Free PMC article.
-
Genetic Architecture of Group A Streptococcal Necrotizing Soft Tissue Infections in the Mouse.PLoS Pathog. 2016 Jul 11;12(7):e1005732. doi: 10.1371/journal.ppat.1005732. eCollection 2016 Jul. PLoS Pathog. 2016. PMID: 27399650 Free PMC article.
References
-
- Levitz RE (1998) Herpes simplex encephalitis: a review. Heart Lung 27: 209–212. - PubMed
-
- Whitley RJ (1990) Viral encephalitis. N Engl J Med 323: 242–250. - PubMed
-
- Whitley RJ (2002) Herpes simplex virus infection. Semin Pediatr Infect Dis 13: 6–11. - PubMed
-
- Corey L (2007) Synergistic copathogens—HIV-1 and HSV-2. N Engl J Med 356: 854–856. - PubMed
Publication types
MeSH terms
Grants and funding
LinkOut - more resources
Full Text Sources
Other Literature Sources
Medical
Molecular Biology Databases
Research Materials
