

The oral minimal model method
- PMID: 24651807
- PMCID: PMC4179313
- DOI: 10.2337/db13-1198
The oral minimal model method
Abstract
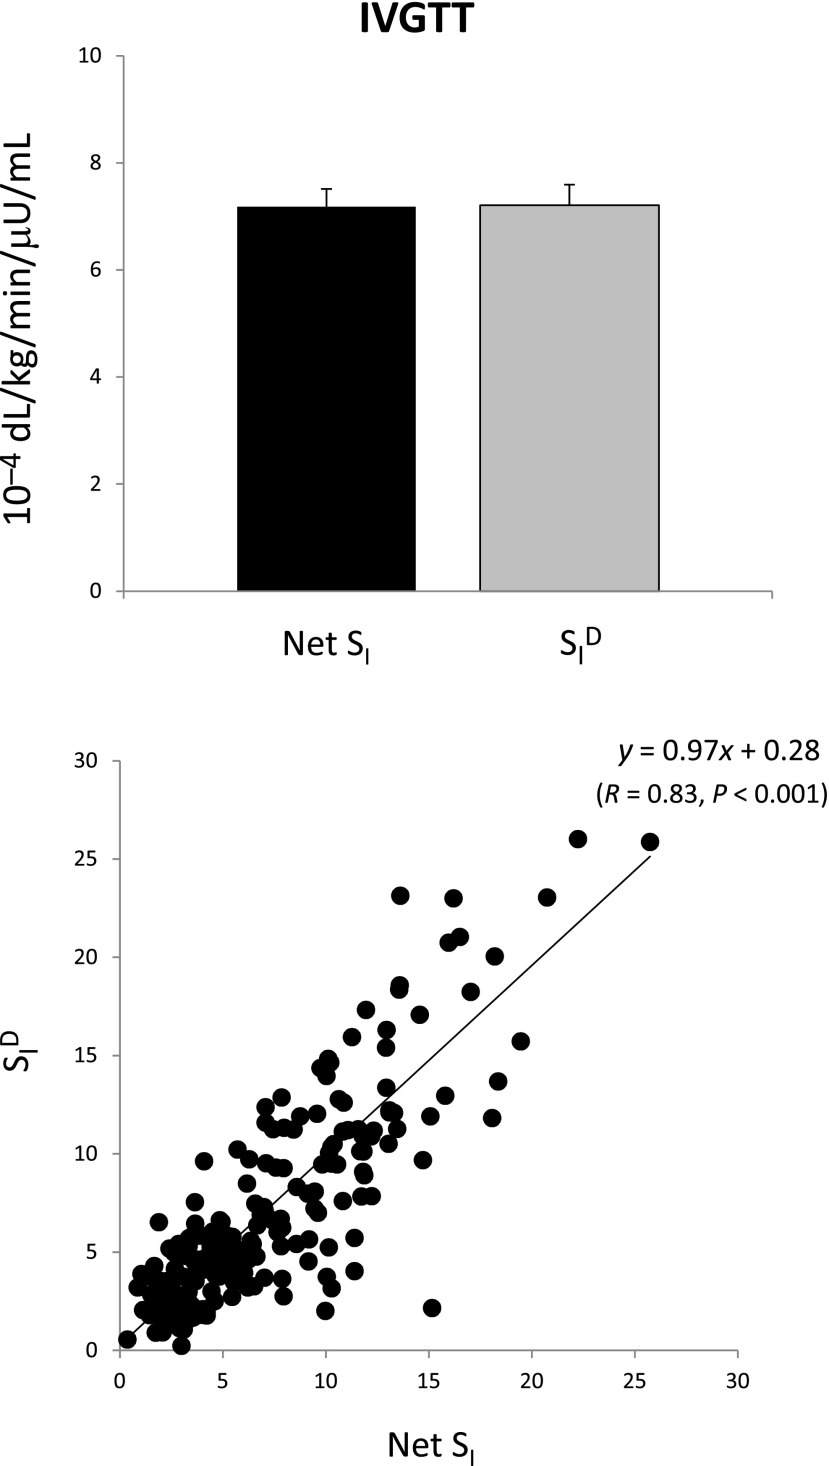
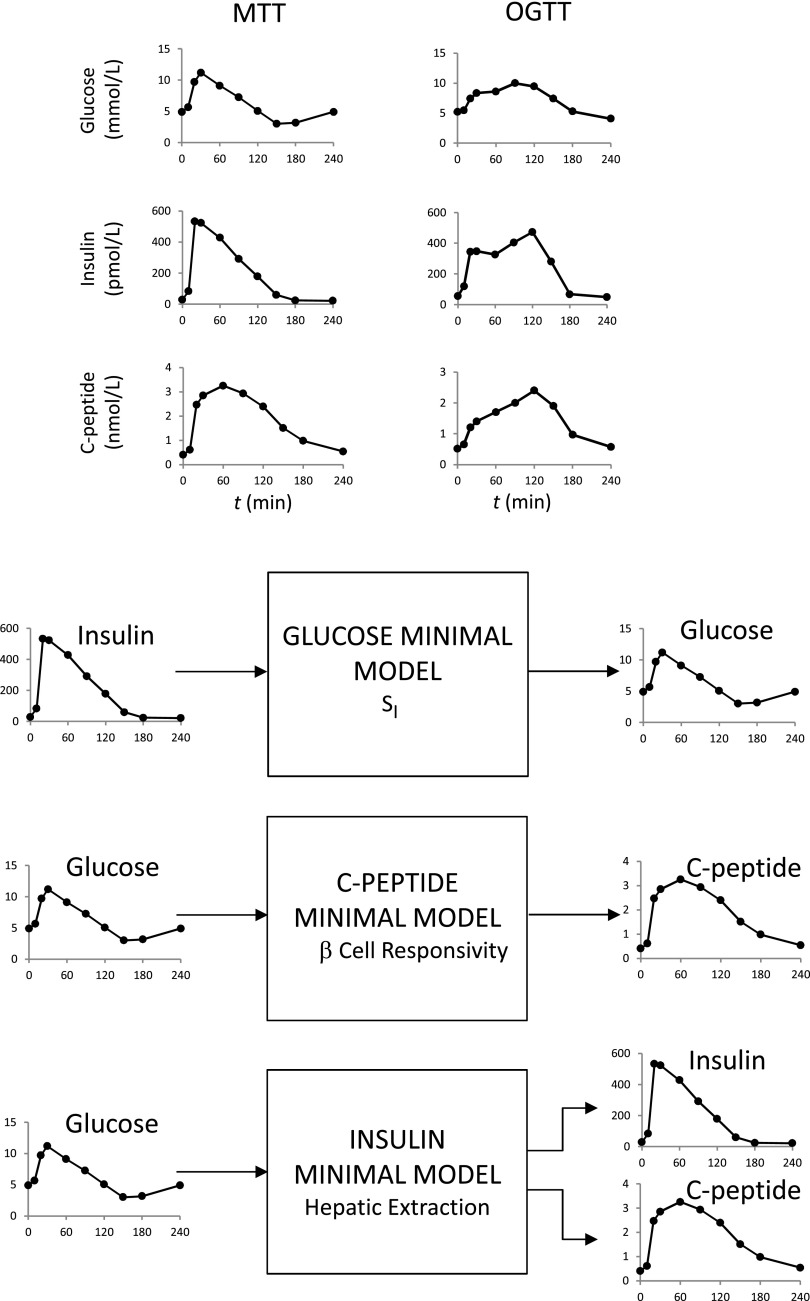
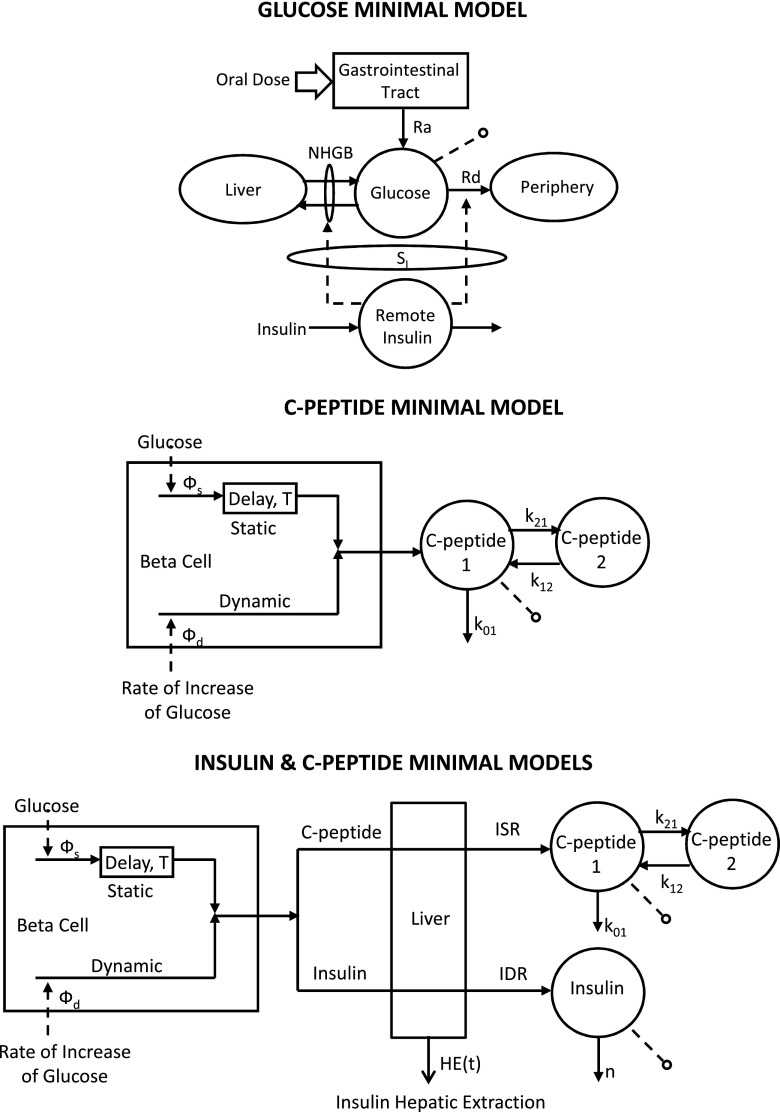
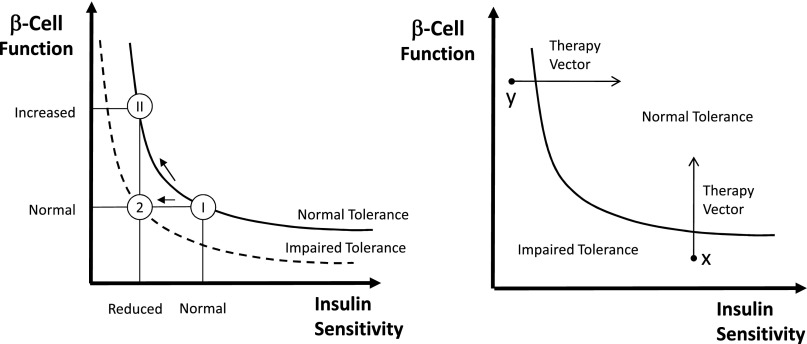
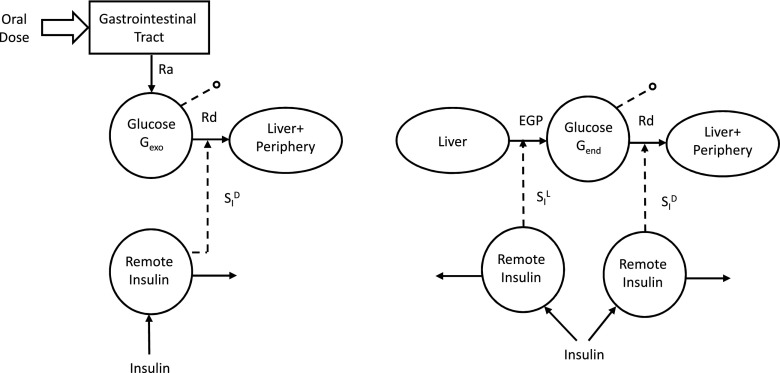
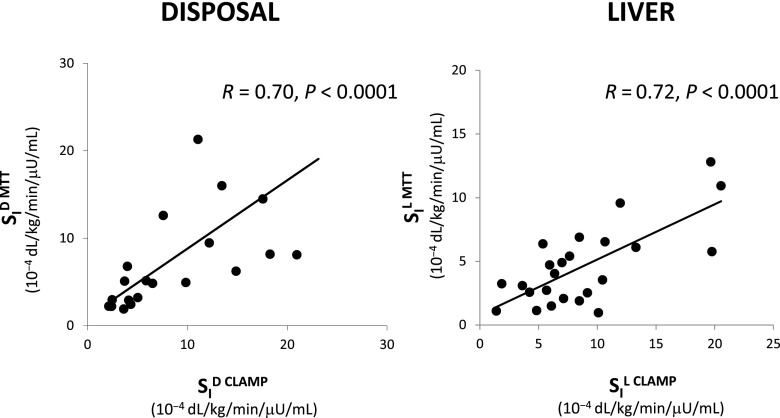
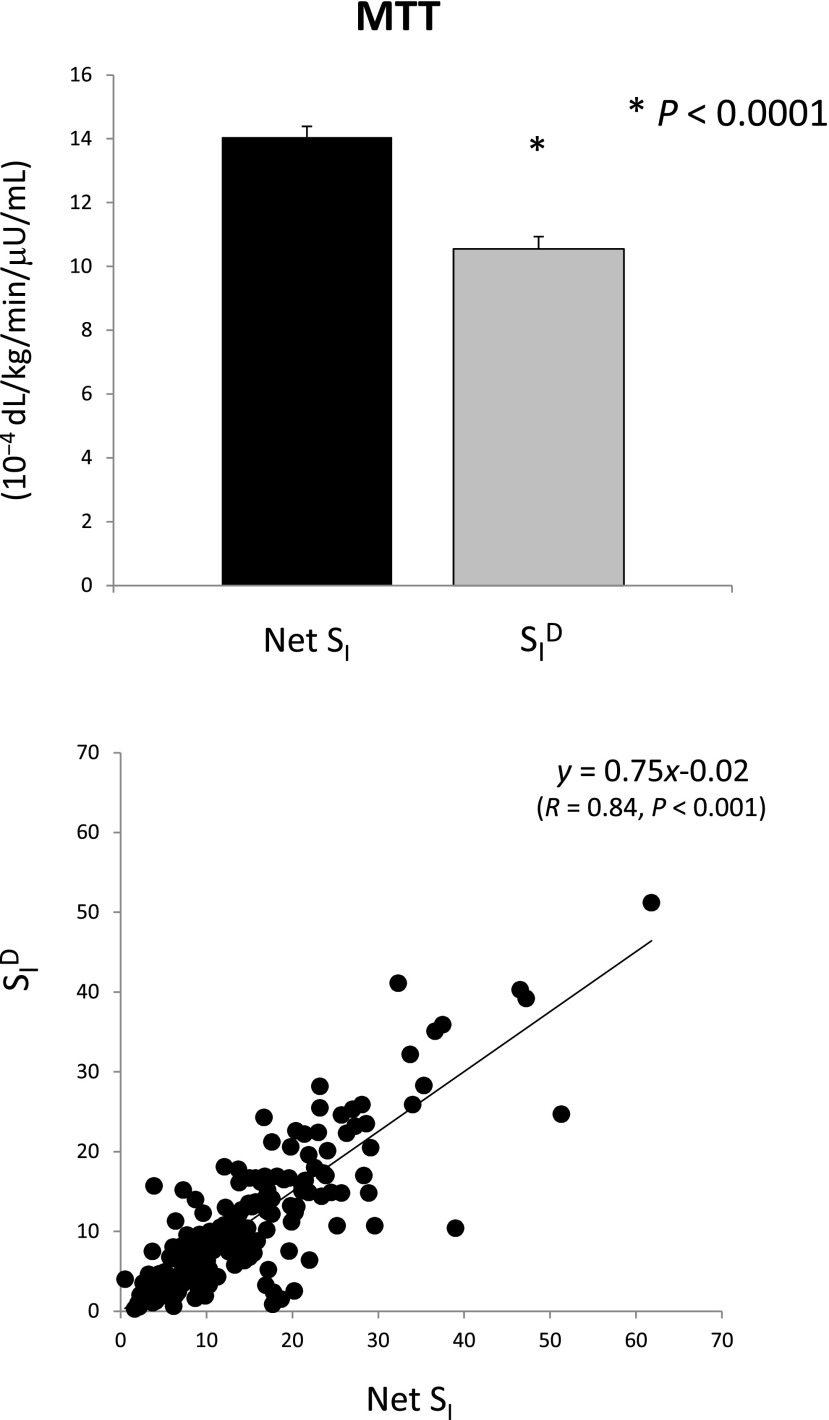
The simultaneous assessment of insulin action, secretion, and hepatic extraction is key to understanding postprandial glucose metabolism in nondiabetic and diabetic humans. We review the oral minimal method (i.e., models that allow the estimation of insulin sensitivity, β-cell responsivity, and hepatic insulin extraction from a mixed-meal or an oral glucose tolerance test). Both of these oral tests are more physiologic and simpler to administer than those based on an intravenous test (e.g., a glucose clamp or an intravenous glucose tolerance test). The focus of this review is on indices provided by physiological-based models and their validation against the glucose clamp technique. We discuss first the oral minimal model method rationale, data, and protocols. Then we present the three minimal models and the indices they provide. The disposition index paradigm, a widely used β-cell function metric, is revisited in the context of individual versus population modeling. Adding a glucose tracer to the oral dose significantly enhances the assessment of insulin action by segregating insulin sensitivity into its glucose disposal and hepatic components. The oral minimal model method, by quantitatively portraying the complex relationships between the major players of glucose metabolism, is able to provide novel insights regarding the regulation of postprandial metabolism.
Figures
Comment in
-
Using oral challenge testing to assess insulin action and secretion with mathematical modeling.Diabetes. 2014 Apr;63(4):1188-90. doi: 10.2337/db13-1839. Diabetes. 2014. PMID: 24651802 Free PMC article. No abstract available.
References
-
- Pisprasert V, Ingram KH, Lopez-Davila MF, Munoz AJ, Garvey WT. Limitations in the use of indices using glucose and insulin levels to predict insulin sensitivity: impact of race and gender and superiority of the indices derived from oral glucose tolerance test in African Americans. Diabetes Care 2013;36:845–853 - PMC - PubMed
-
- Reaven GM. What do we learn from measurements of HOMA-IR? Diabetologia 2013;56:1867–1868 - PubMed
-
- Bergman RN, Ider YZ, Bowden CR, Cobelli C. Quantitative estimation of insulin sensitivity. Am J Physiol 1979;236:E667–E677 - PubMed
Publication types
MeSH terms
Substances
Grants and funding
LinkOut - more resources
Full Text Sources
Other Literature Sources
Medical
