. 2014 Apr;63(4):1394-409.
doi: 10.2337/db13-0334.

Identification of a small molecular insulin receptor agonist with potent antidiabetes activity

Affiliations

Identification of a small molecular insulin receptor agonist with potent antidiabetes activity

Guifen Qiang et al. Diabetes. 2014 Apr.

Abstract

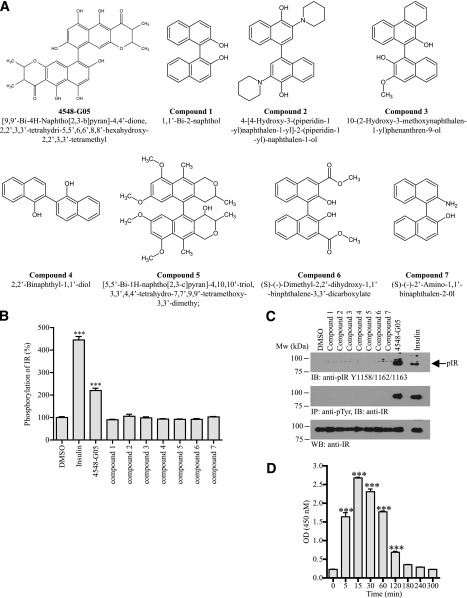
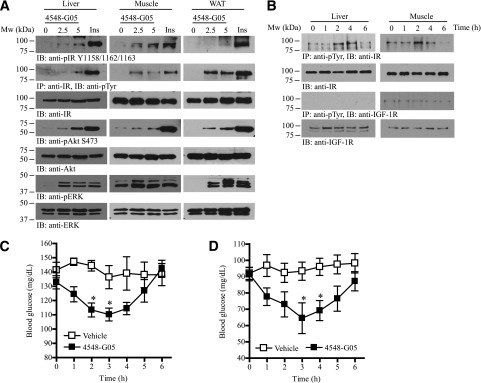
Insulin replacement therapy is a widely adopted treatment for all patients with type 1 diabetes and some with type 2 diabetes. However, injection of insulin has suffered from problems such as tissue irritation, abscesses, discomfort, and inconvenience. The use of orally bioactive insulin mimetics thus represents an ideal treatment alternative. Here we show that a chaetochromin derivative (4548-G05) acts as a new nonpeptidyl insulin mimetic. 4548-G05 selectively activates an insulin receptor (IR) but not insulin-like growth factor receptor-I or other receptor tyrosine kinases. Through binding to the extracellular domain of the IR, 4548-G05 induces activation of the receptor and initiates the downstream Akt and extracellular signal-related kinase pathways to trigger glucose uptake in C2C12 myotubes. Moreover, it displays a potent blood glucose-lowering effect when administrated orally in normal, type 1 diabetic, and type 2 diabetic mice models. Therefore, 4548-G05 may represent a novel pharmacological agent for antidiabetes drug development.


Figures

Figure 1
Figure 1
4548-G05 activates the IR. A: Chemical structures of 4548-G05 and its derivatives. B: Effects of 4548-G05 and its derivatives on IR phosphorylation in CHO-IR cells. CHO-IR cells were treated with insulin (100 nmol/L) or various 4548-G05 derivatives (10 μmol/L) for 15 min. The amount of phosphorylated IR was quantified by sandwich ELISA using immobilized antiphosphotyrosine antibody (PY20) and anti-IR antibody. Activities of the tested compounds are expressed as a percentage of control (DMSO). ***P < 0.001, one-way ANOVA vs. DMSO (n = 3). C: Western blot analysis of IR phosphorylations provoked by 4548-G05 in CHO-IR cells. CHO-IR cells were treated with insulin (100 nmol/L) or various 4548-G05 derivatives (10 μmol/L) for 15 min. IR phosphorylation then was determined by anti-pIR Y1158/1162/1163 antibody (top panel) or immunoprecipitated by PY20 and analyzed using anti-IR (middle panel). Expression of IR also is shown (bottom panel). D: 4548-G05 induces IR phosphorylation in a time-dependent manner. CHO-IR cells were treated with 4548-G05 (10 μmol/L) for different time intervals and the IR Y1150/1151 phosphorylation was monitored by sandwich ELISA. ***P < 0.001, one-way ANOVA vs. 0 min (n = 3).
Figure 2
Figure 2
4548-G05 activates IR signaling. A: CHO-IR cells were treated with insulin (100 nmol/L) or 4548-G05 (10 μmol/L) for 15 min. Total tyrosine phosphorylation of the IRS-1 was monitored by immunoprecipitated (first panel). Phosphorylations of Akt (S473) and ERK (T202/Y204) also were determined (third and fifth panels). Expression of IRS-1 (second panel), Akt (fourth panel) and ERK (sixth panel) also were examined. B: 4548-G05 induced IR phosphorylation in a dose-dependent manner. CHO-IR cells were treated with 4548-G05 at different concentrations for 15 min. The IR phosphorylation then was determined using immunoprecipitation (second panel) or antibody against phospho-Y1158/1162/1163 (first panel). Phosphorylation on Akt S473 also was monitored (fourth panel). Expressions of IR (third panel) and Akt (fifth panel) also were verified. C: 4548G-05 synergizes insulin-induced IR autophosphorylation. CHO-IR cells were stimulated with various combinations of 4548-G05 and insulin as indicated for 30 min. The IR Y1150/1151 phosphorylation then was monitored by sandwich ELISA. **P < 0.01; ***P < 0.001; one-way ANOVA (n = 3). D: 4548-G05 induces IR endocytosis. Internalization of biotinylated IR on the surface of CHO-IR cells was detected after stimulation with 4548-G05 (10 μmol/L) or insulin (100 μmol/L) and Pronase treatment (top panel) using streptavidin pull-down. The amount of total IR input also was examined (bottom panel). E: 4548-G05 does not induce IGFR phosphorylation. CHO-IGFR cells were treated with IGF-1 (100 nmol/L) or 4548-G05 (10 μmol/L) for 15 min. IGFR phosphorylation on Y1131 then was analyzed by immunoblotting (first panel). Akt phosphorylation on S473 also was examined (third panel). Expressions of IGFR (second panel) and Akt (fourth panel) also are shown. F: 4548-G05 does not induce epidermal growth factor (EGF) receptor phosphorylation. HEK293 cells were treated with EGF (100 nmol/L) or 4548-G05 (10 μmol/L) for 15 min. The cell lysates were analyzed by immunoblotting using anti–EGF receptor Y1068 (top panel) and anti-EGF receptor (bottom panel).
Figure 3
Figure 3
4548-G05 binds to the ECD of IR. A: D4548-G05 alters the proteolytic cleavage pattern of IR-ECD. Recombinant IR-ECD (left panel) and human zyxin fragment (right panel) were subjected to limited trypsin digestion in the presence of DMSO or 4548-G05 (50 μmol/L). The reaction was resolved in SDS-PAGE followed by silver staining. B: Intrinsic fluorescence emission quenching of recombinant IR-ECD (250 nmol/L) with increasing concentrations of 4548-G05. C: Titration curve of IR-ECD fluorescence quenching in the presence of 4548-G05. D: 4548-G05 is a reversible ligand of IR. The Trp fluorescence of IR was decreased when 4548-G05 bound to IR (IR + G5). After centrifugation, the unbound 4548-G05 was filtered. When the 4548-G05/IR complex in the top chamber was reconstituted, some of the bound 4548-G05 dissociated from the ligand/receptor complex and reached a new equilibrium, which is indicated by the increase of intrinsic IR fluorescence (IR + G5 [centrifugation]). E: 4548-G05 does not compete with insulin for IR binding. CHO-IR cells were incubated with FITC-insulin in the presence of unlabeled insulin (left panel) or various concentration of 4548-G05 (middle panel). Parental CHO cells were used as a negative control (right panel). The fluorescence-labeled cells were analyzed by flow cytometry.
Figure 4
Figure 4
4548-G05 activates IR in myotubes and enhances cellular glucose uptake. A: 4548-G05 provokes IR signaling in differentiated C2C12 cells. Differentiated C2C12 myotubes were stimulated with insulin (100 nmol/L) or 4548-G05 (1, 5, and 10 μmol/L) for 30 min. Insulin signaling in the cell lysates was tested by immunoprecipitation and immunoblotting. B: IR is necessary for 4548-G05 to induce ERK phosphorylation. Differentiated C2C12 myotubes were transfected with scramble siRNA (si-Control) or siRNA against IR (si-IR). After 72 h the cells were stimulated with insulin (100 nmol/L) or 4548-G05 (10 μmol/L) for 30 min. Cell lysates were analyzed by immunoblotting. C: 4548-G05 stimulates glucose uptake. Differentiated C2C12 myotubes were stimulated with insulin (100 nmol/L) or 4548-G05 (1, 5, and 10 μmol/L) for 30 min. [3H]-2-deoxyglucose then was added and the cells were incubated for another 10 min. After cell lysis, the radioactivity uptake by the myotubes was measured by scintillation counting. **P < 0.01 vs. control, one-way ANOVA (n = 3). D: 4548-G05 synergizes insulin signaling. Differentiated C2C12 myotubes were stimulated with 5 nmol/L insulin, 50 nmol/L 4548-G05, or a combination of the 2 drugs. Cell lysates then were prepared for immunoprecipitation and immunoblotting using specific antibodies as indicated. E: 4548-G05 synergizes insulin activity in promoting glucose uptake. Differentiated C2C12 myotubes were stimulated for 30 min with 50 nmol/L insulin, 200 nmol/L 4548-G05, or a combination of the 2 drugs. [3H]-2-deoxyglucose then was added, and the cells were incubated for another 10 min. The [3H]-2-deoxyglucose taken by the myotubes was measured by scintillation counting after cell lysis. **P < 0.01; ***P < 0.001; one-way ANOVA (n = 3).
Figure 5
Figure 5
4548-G05 activates insulin signaling pathways in vivo and possesses hypoglycemic activity. A: 4548-G05 quickly activates IR and its downstream signaling in mice. Eight-week-old C57BL/6J mice were starved for 12 h and then vehicle, 4548-G05 (2.5 or 5 mg/kg), or human insulin (Ins; 1U/kg) was injected via the vena cava. After 5 min, the liver, muscle, and fat tissues were collected and analyzed by immunoblotting and immunoprecipitation using specific antibodies. B: Oral administration of 4548-G05 provokes IR phosphorylation and its downstream signaling in mice. Eight-week-old C57BL/6J mice were starved for 12 h and then 4548-G05 (10 mg/kg) was orally administered. Cell lysates were prepared from liver and muscle tissues collected at various time intervals and analyzed by immunoprecipitation and immunoblotting. C: 4548-G05 decreases blood glucose concentration in fed C57BL/6J mice. Vehicle (0.5% methylcellulose) or 4548-G05 (10 mg/kg) was orally administered to 8-week-old C57BL/6J mice. Blood glucose was monitored before and after dosing at the different time points as indicated. *P < 0.05 vs. vehicle, one-way ANOVA (n = 5). D: 4548-G05 decreases blood glucose concentration in fasted C57BL/6J mice. Eight-week-old C57BL/6J mice were starved for 12 h and then vehicle (0.5% methylcellulose) or 4548-G05 (10 mg/kg) was orally administered. Blood glucose was monitored before and after dosing at the different time points indicated. *P < 0.05 vs. vehicle, one-way ANOVA (n = 5).
Figure 6
Figure 6
4548-G05 displays hypoglycemic activity in diabetic animal models. A: 4548-G05 activates insulin signaling in db/db mice. Eight-week-old mice were starved for 12 h and then 4548-G05 (5 mg/kg) was orally administered. Cell lysates were prepared from liver, muscle, and fat tissues that were collected at different time intervals and analyzed by immunoprecipitation and immunoblotting. B: 4548-G05 reduces blood glucose levels in fed db/db mice. Vehicle (0.5% methylcellulose) or 4548-G05 (5 mg/kg) was orally administered to the animals. Blood glucose was monitored before and after dosing at 1-h intervals. *P < 0.05 vs. vehicle; two-way ANOVA (n = 6). C: 4548-G05 reduces blood glucose level in fasted db/db mice. The animals were starved for 12 h and then vehicle (0.5% methylcellulose) or 4548-G05 (5 mg/kg) was orally administered. Blood glucose was monitored before and after dosing at 1-h intervals (n = 5). ***P < 0.001 vs. vehicle; two-way ANOVA. D: 4548-G05 improves the glucose tolerance in db/db mice. The animals were starved for 12 h and then vehicle (0.5% methylcellulose) or 4548-G05 (5 mg/kg) was orally administered 1 h before a bolus injection of glucose (0.3 mg/kg). Blood glucose was measured at the indicated time intervals (n = 5). E: Area under the curve of the glucose tolerance test shown in D. *P < 0.05, Student t test (n = 5). F: Hypoglycemic activity of 4548-G05 in mice with STZ-induced T1DM. C57BL/6 mice (8 weeks old) were divided into two groups 7 days after a single intraperitoneal injection of STZ (150 mg/kg). The animals then were starved for 12 h and vehicle (0.5% methylcellulose) or 4548-G05 (5 mg/kg) was orally administered. Blood glucose was measured at the indicated time intervals. ***P < 0.001 vs. vehicle; two-way ANOVA (n = 5). G: Chronic treatment with 4548-G05 given to db/db mice improves the hyperglycemia. Vehicle (0.5% methylcellulose) or 4548-G05 (5 mg/kg) was administrated orally once a day for 10 consecutive days to 8-week-old db/db mice. Blood glucose of the fed animals then was measured at various time intervals as indicated. *P < 0.05, two-way ANOVA (n = 5).

Similar articles

Cited by

References

    1. Saltiel AR, Kahn CR. Insulin signalling and the regulation of glucose and lipid metabolism. Nature 2001;414:799–806 - PubMed
    1. Desvergne B, Michalik L, Wahli W. Transcriptional regulation of metabolism. Physiol Rev 2006;86:465–514 - PubMed
    1. Bluestone JA, Herold K, Eisenbarth G. Genetics, pathogenesis and clinical interventions in type 1 diabetes. Nature 2010;464:1293–1300 - PMC - PubMed
    1. Campbell RK. Type 2 diabetes: where we are today: an overview of disease burden, current treatments, and treatment strategies. J Am Pharm Assoc (2003) 2009;49(Suppl. 1):S3–S9 - PubMed
    1. Richardson T, Kerr D. Skin-related complications of insulin therapy: epidemiology and emerging management strategies. Am J Clin Dermatol 2003;4:661–667 - PubMed

Publication types

Substances