. 2014 Mar 20;9(3):e92451.
doi: 10.1371/journal.pone.0092451. eCollection 2014.

High-throughput epitope binning assays on label-free array-based biosensors can yield exquisite epitope discrimination that facilitates the selection of monoclonal antibodies with functional activity

Affiliations

High-throughput epitope binning assays on label-free array-based biosensors can yield exquisite epitope discrimination that facilitates the selection of monoclonal antibodies with functional activity

Yasmina Noubia Abdiche et al. PLoS One. .

Abstract

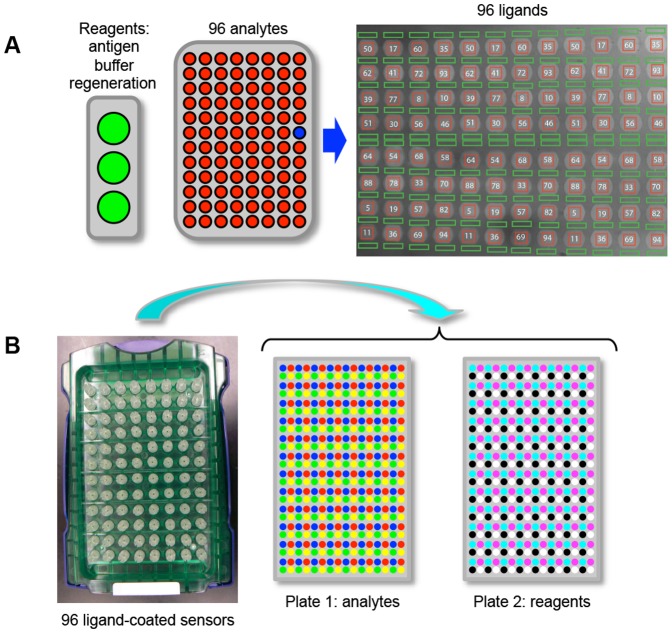
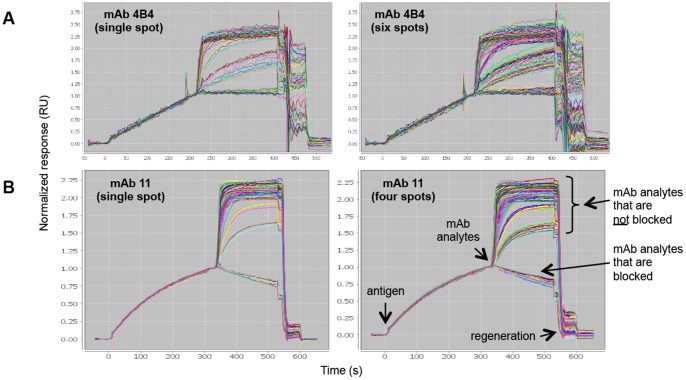
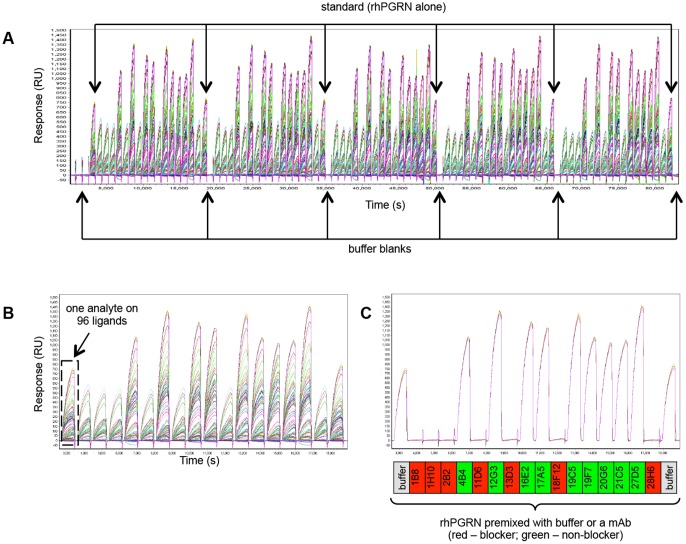
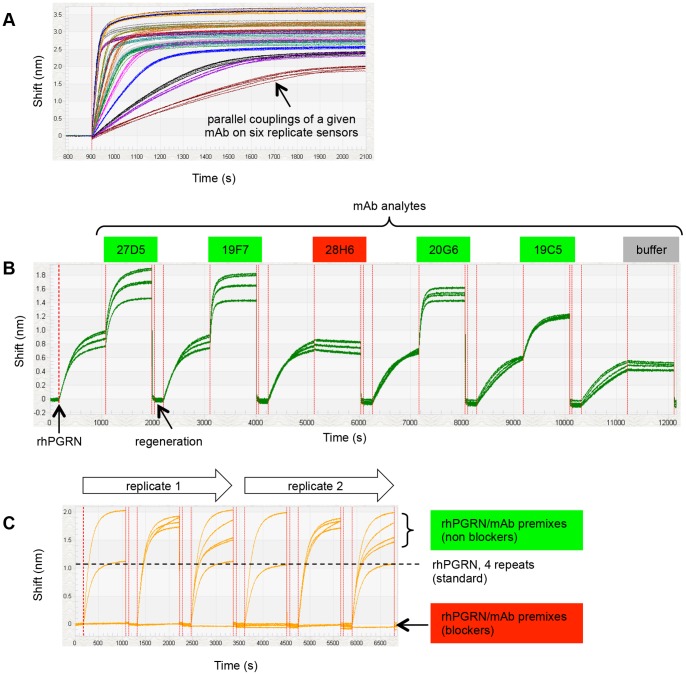
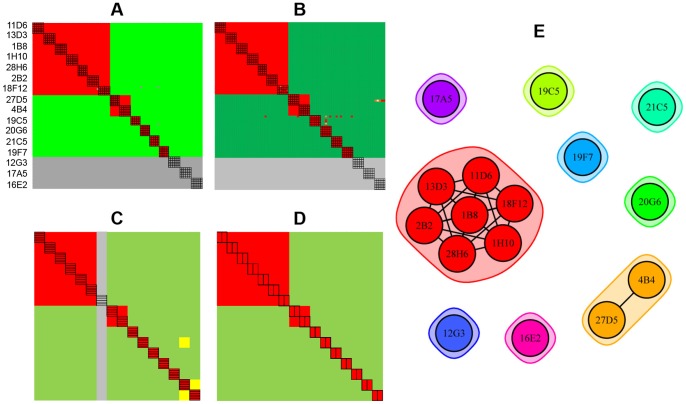
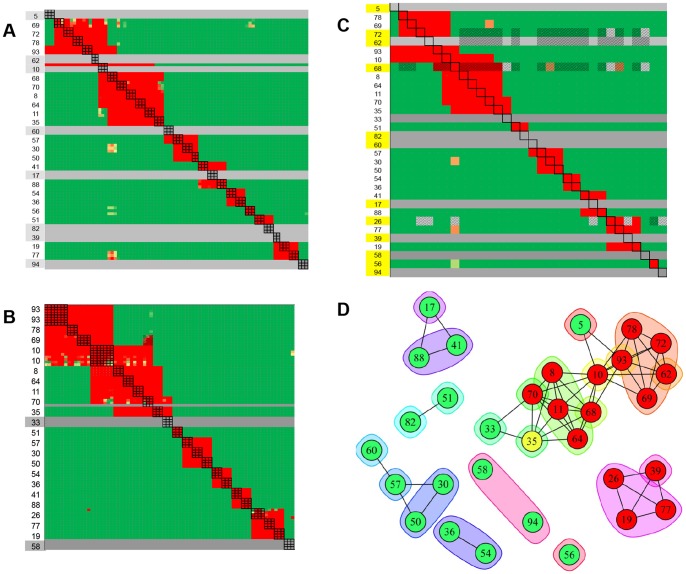
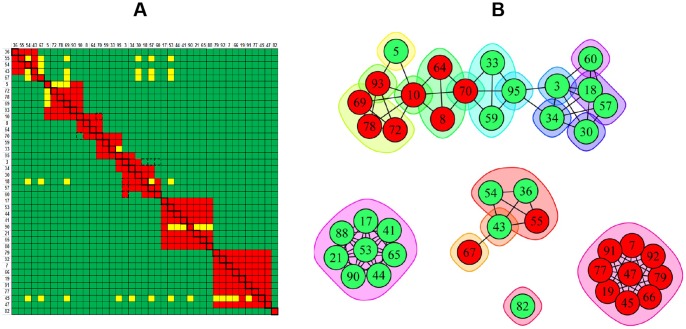
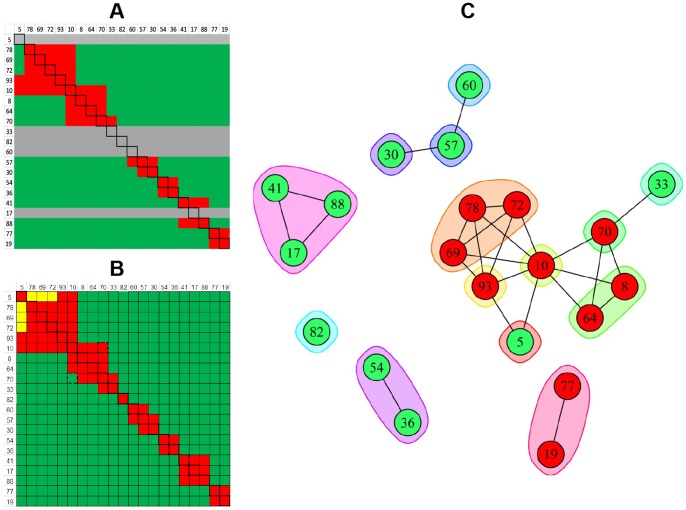
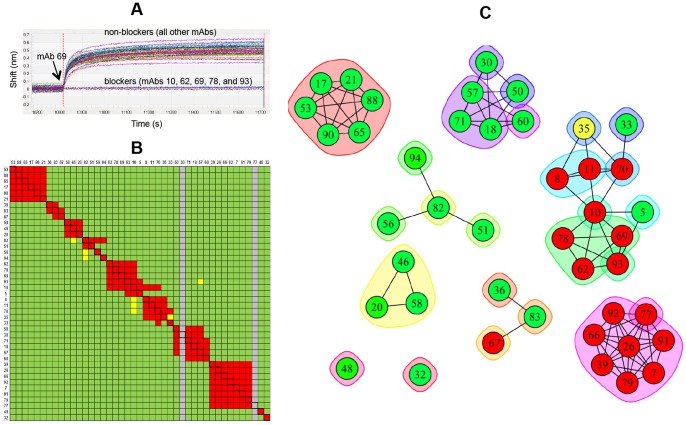
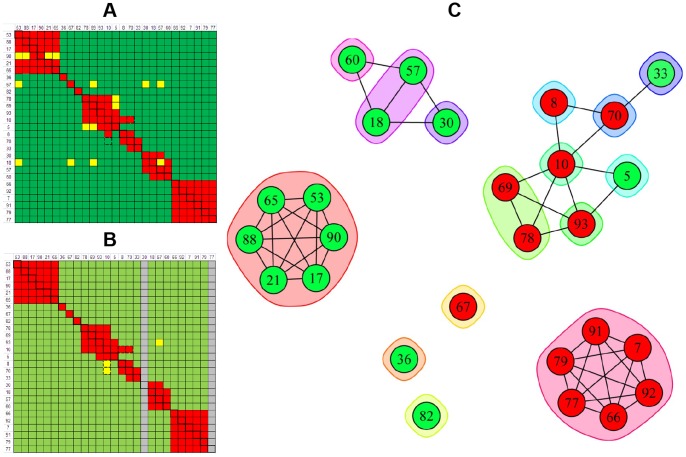
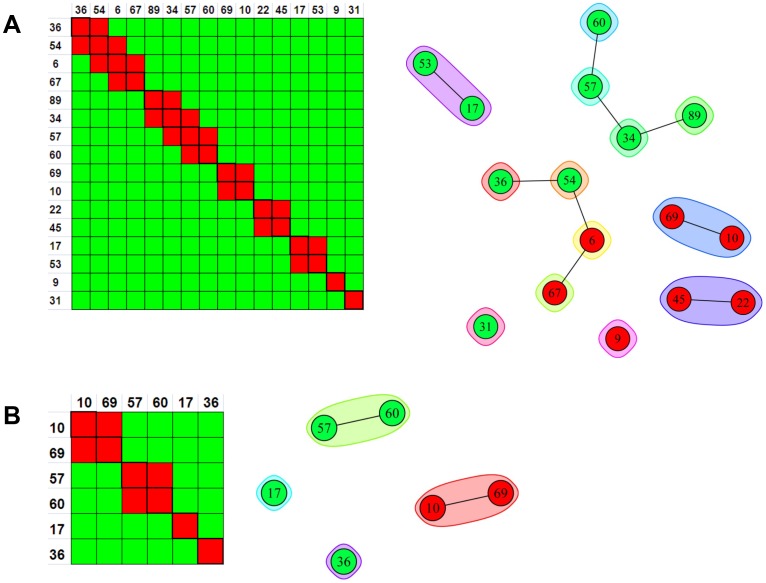
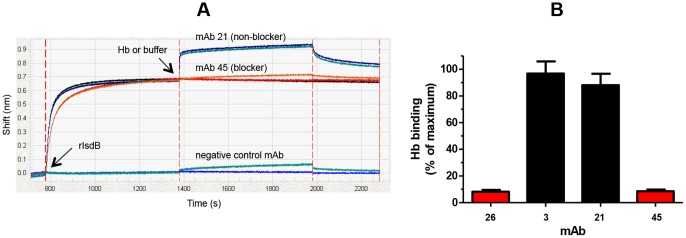
Here, we demonstrate how array-based label-free biosensors can be applied to the multiplexed interaction analysis of large panels of analyte/ligand pairs, such as the epitope binning of monoclonal antibodies (mAbs). In this application, the larger the number of mAbs that are analyzed for cross-blocking in a pairwise and combinatorial manner against their specific antigen, the higher the probability of discriminating their epitopes. Since cross-blocking of two mAbs is necessary but not sufficient for them to bind an identical epitope, high-resolution epitope binning analysis determined by high-throughput experiments can enable the identification of mAbs with similar but unique epitopes. We demonstrate that a mAb's epitope and functional activity are correlated, thereby strengthening the relevance of epitope binning data to the discovery of therapeutic mAbs. We evaluated two state-of-the-art label-free biosensors that enable the parallel analysis of 96 unique analyte/ligand interactions and nearly ten thousand total interactions per unattended run. The IBIS-MX96 is a microarray-based surface plasmon resonance imager (SPRi) integrated with continuous flow microspotting technology whereas the Octet-HTX is equipped with disposable fiber optic sensors that use biolayer interferometry (BLI) detection. We compared their throughput, versatility, ease of sample preparation, and sample consumption in the context of epitope binning assays. We conclude that the main advantages of the SPRi technology are its exceptionally low sample consumption, facile sample preparation, and unparalleled unattended throughput. In contrast, the BLI technology is highly flexible because it allows for the simultaneous interaction analysis of 96 independent analyte/ligand pairs, ad hoc sensor replacement and on-line reloading of an analyte- or ligand-array. Thus, the complementary use of these two platforms can expedite applications that are relevant to the discovery of therapeutic mAbs, depending upon the sample availability, and the number and diversity of the interactions being studied.


Conflict of interest statement

Competing Interests: The authors declare that no competing interests exist. More than one of the authors are employed by the commercial funders of this research study (Rinat-Pfizer Inc) and two authors are employed by a commercial company (Wasatch Microfluidics Inc). This does not alter the authors' adherence to PLOS ONE policies on sharing data and materials.

Figures

Figure 1
Figure 1. Assay set-up and autosampler capacity of two array-based biosensors.
(A) A CFM is used to print a microarray of 96 mAbs onto a sensor chip, which is then loaded into a SPRi reader. In the image of the 96-ligand array shown here, the red squares define the reaction spots (named by mAb) and the green rectangles define the interstitial reference spots (two per adjacent reaction spot). The SPRi is equipped with an autosampler that injects an analyte and cycles it back-and-forth across the flow cell. Up to 96 analytes are accommodated in a 96-well microplate and common reagents (i.e., antigen, buffer, and regeneration) are accommodated in 11-ml vials. (B) In the BLI system, 96 ligand-coated fiber optic sensors are dipped in parallel into a 96-analyte array. Analytes and common reagents are distributed across two 384-well microplates. The sample layout depicts that used for a typical classical sandwich epitope binning assay (see Table 1 ).
Figure 2
Figure 2. SPRi analysis of epitope binning assays on independent arrays using a classical sandwich assay format.
The model antigens used were (A) rhPGRN and (B) rIsdB. Each overlay plot shows the sensorgrams for 100 binning cycles (i.e., 96 mAb analytes and buffer blank analytes) on a single spot (left) or replicate spots (right) of a coupled mAb, as indicated. Responses are normalized to 1 at the end of the antigen capture step to facilitate the comparison of different capacity spots.
Figure 3
Figure 3. SPRi analysis of sixteen anti-hPGRN mAbs using a premix epitope binning assay format.
(A) Serial view of the sensorgrams obtained for 94 analytes (i.e., five replicate sets of rhPGRN/mAb premixed samples, interspersed with replicates of rhPGRN alone and buffer blanks), (B) zoomed in view of the first set of analytes, and (C) same view as panel B, but showing an overlay plot for three spots coupled with mAb 1B8 at similar capacities (the other three spots coupled with mAb 1B8 had different capacities because those surfaces were prepared in a subsequent print; they are excluded for clarity). Response data is aligned to zero at the start of each analyte injection and the regeneration steps have been excluded from view.
Figure 4
Figure 4. BLI analysis of sixteen anti-hPGRN mAbs using complementary epitope binning assay formats.
(A) Overlay plot for the coupling of 96 mAbs on parallel sensors (six replicate sets of sixteen mAbs). (B) Sensorgrams obtained from a classical sandwich assay on six sensors coupled with mAb 1B8 (the sensorgrams cluster into three pairs of curves because the couplings were performed on duplicate sensors in three consecutive runs). Analytes highlighted in green have different epitopes than the ligand (i.e., 1B8 does not block 27D5, 19F7, 20G6, or 19C5) whereas the analyte highlighted in red has an epitope that overlaps with that of the ligand (i.e., 1B8 blocks 28H6). (C) Sensorgrams obtained from a premix assay on six sensors coupled with mAb 2B2 (the same analyte wells were tested in duplicate cycles). Panels B and C are representative of the much larger data sets generated in those experiments. Response data are aligned to zero at the start of the sensorgrams.
Figure 5
Figure 5. Technology comparison of epitope binning assays on sixteen anti-hPGRN mAbs using complementary assay formats.
Heat maps for (A) SPRi – classical sandwich, (B) SPRi – premix, (C) BLI – classical sandwich, and (D) BLI – premix experiments. (E) Node plot of the deduced bin assignments from panels A–D. All experiments were conducted on a 96-ligand array (i.e., sixteen mAbs coupled onto six surfaces each). Sixteen mAbs were each used as analyte (A) up to six times, (B) up to five times, (C) once, and (D) twice. In the heat maps, the rows represent the ligands and the columns represent the analytes, in the same order. Analyte/ligand pairs are assigned as blocked (red), not blocked (green), or ambiguous (yellow), and self-blocks are outlined with a black box. Panels A, B and D each represent the results for a single experiment, whereas panel C represents the consolidated results from three separate experiments on the same sensors, because the autosampler capacity allowed for a maximum of five mAb analytes per experiment. Grey rows in panels A and B indicate inactive ligands and the grey columns indicate mAbs that were not tested as analyte.
Figure 6
Figure 6. SPRi analysis of anti-IsdB mAbs using a classical sandwich epitope binning assay format.
(A and B) Heat maps for two independent experiments on intersecting panels of mAbs. (C) Merged heat map of the 32 unique mAbs condensed to one cell per mAb pair. Grey rows represent inactive ligands and mAbs highlighted in yellow were not represented in both experiments. (D) Node plot of the epitope bin assignments deduced from panel C (mAbs are colored by their functional activity, where green - not blocked, red - block and yellow - partial blocker; see Figure 12). MAbs 5, 17, 33, 39, 58, 60, 62, 82, and 94 were inactive as ligand (i.e., orphan analytes), so were not tested for cross-blocking against one another. Therefore, every orphan is in its own bin (i.e., each is inscribed by its own envelope) to indicate that the missing orphan/orphan cross-blocking information could change their bin assignments. For example, mAbs 19, 26, 39 and 77 mutually cross-block one another so tentatively belong to the same bin, but mAb 39 is inscribed by its own envelope to indicate that it is an orphan analyte. Similarly mAbs 17, 41, and 88 mutually cross-block one another, but mAb 17 is inscribed by its own envelope because it is an orphan analyte. Orphans 58 and 94 tentatively belong to the same bin because they were not blocked by any ligand, but there is no chord connecting them because the 58/94 cross-blocking information is missing.
Figure 7
Figure 7. BLI analysis of 41 anti-IsdB mAbs using a classical sandwich epitope binning assay format.
(A) Heat map and (B) node plot.
Figure 8
Figure 8. Technology comparison of classical sandwich assays performed on 21 anti-IsdB mAbs.
Heat maps obtained from (A) SPRi (see Figure 6C) and (B) BLI (see Figure 7A). (C) Node plot.
Figure 9
Figure 9. BLI analysis of 43 anti-IsdB mAbs using an in tandem epitope binning assay format.
(A) Response data for mAb 69 binding as analyte to anti-His-captured rIsdB that was saturated by a 48-mAb array, (B) heat map, and (C) node plot.
Figure 10
Figure 10. BLI analysis of 27 anti-IsdB mAbs using complementary epitope binning assay formats.
Heat maps for (A) classical sandwich and (B) in tandem approaches. (C) Node plot.
Figure 11
Figure 11. Heat maps and node plots for epitope binning experiments on small panels of anti-IsdB mAbs.
(A) BLI analysis of sixteen mAbs using an in tandem epitope binning assay format; the same result was obtained from two independent experiments in which the antigen was captured via anti-His or anti-Flag surfaces. (B) Binning result for the six mAbs that were common to all rIsdB experiments shown in Figures 6–11A.
Figure 12
Figure 12. Correlation of epitope bin with functional activity.
Example of Hb-blocking data obtained for select anti-IsdB mAbs using (A) rIsdB in a BLI assay and (B) native IsdB in a cell-based assay (the bars and error bars represent the mean and standard deviation for three independent measurements).

References

    1. Klein C, Lammens A, Schafer W, Georges G, Schwaiger M, et al. (2013) Epitope interactions of monoclonal antibodies targeting CD20 and their relationship to functional properties. MAbs 5: 22–33. - PMC - PubMed
    1. Markovitz RC, Healey JF, Parker ET, Meeks SL, Lollar P (2013) The diversity of the immune response to the A2 domain of human factor VIII. Blood 121: 2785–2795. - PMC - PubMed
    1. EL-Manzalawy Y, Honavar V (2010) Recent advances in B-cell epitope prediction methods. Immunome Research (Suppl 2):S2. - PMC - PubMed
    1. Emde A, Pradeep C-R, Ferraro DA, Ben-Chetrit N, Sela M, et al. (2011) Combining epitope-distinct antibodies to HER2: cooperative inhibitory effects on invasive growth. Oncogene 30: 1631–1642. - PMC - PubMed
    1. Koefoed K, Steinaa L, Søderberg JN, Kjær I, Jacobsen HJ, et al. (2011) Rational identification of an optimal antibody mixture for targeting the epidermal growth factor receptor. MAbs 3: 584–595. - PMC - PubMed

Publication types

MeSH terms