. 2014 May 2;289(18):12467-84.
doi: 10.1074/jbc.M114.554162. Epub 2014 Mar 20.

Insulin and metabolic stress stimulate multisite serine/threonine phosphorylation of insulin receptor substrate 1 and inhibit tyrosine phosphorylation

Affiliations

Insulin and metabolic stress stimulate multisite serine/threonine phosphorylation of insulin receptor substrate 1 and inhibit tyrosine phosphorylation

Nancy J Hançer et al. J Biol Chem. .

Abstract

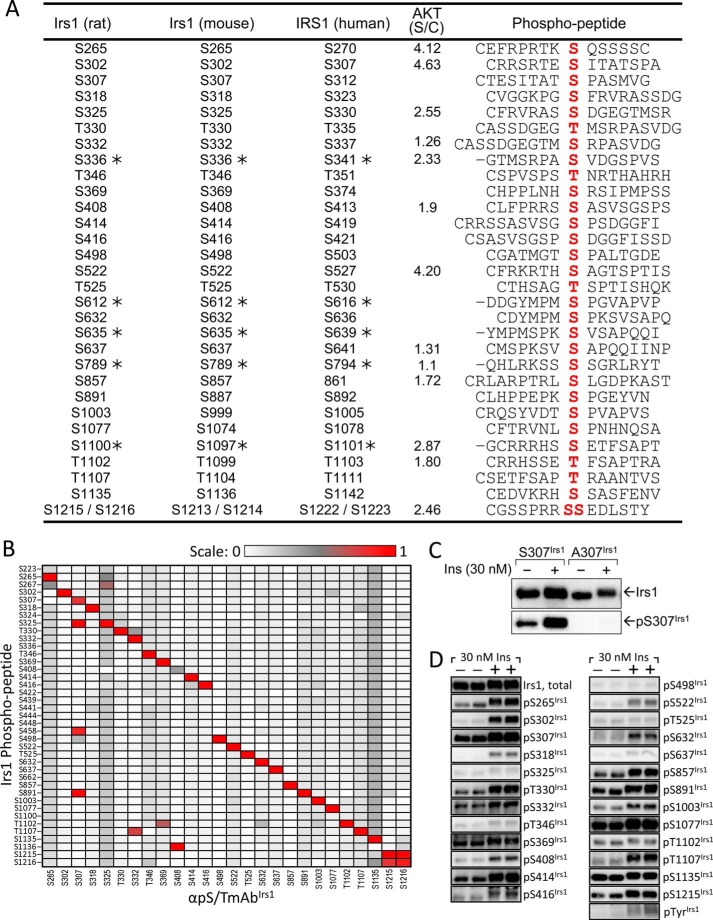
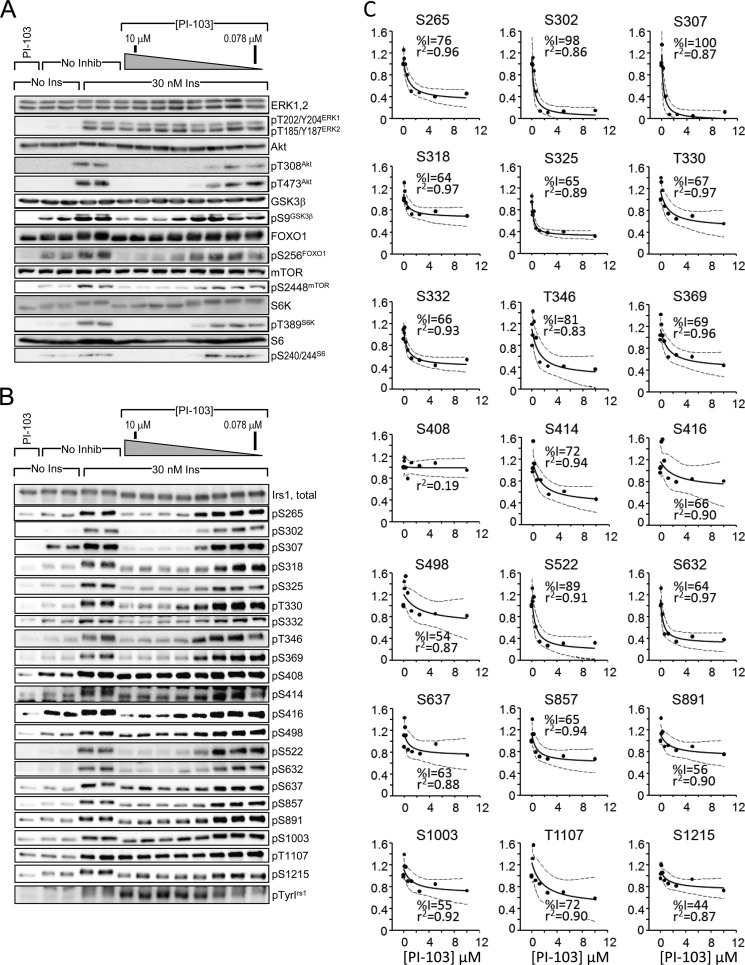
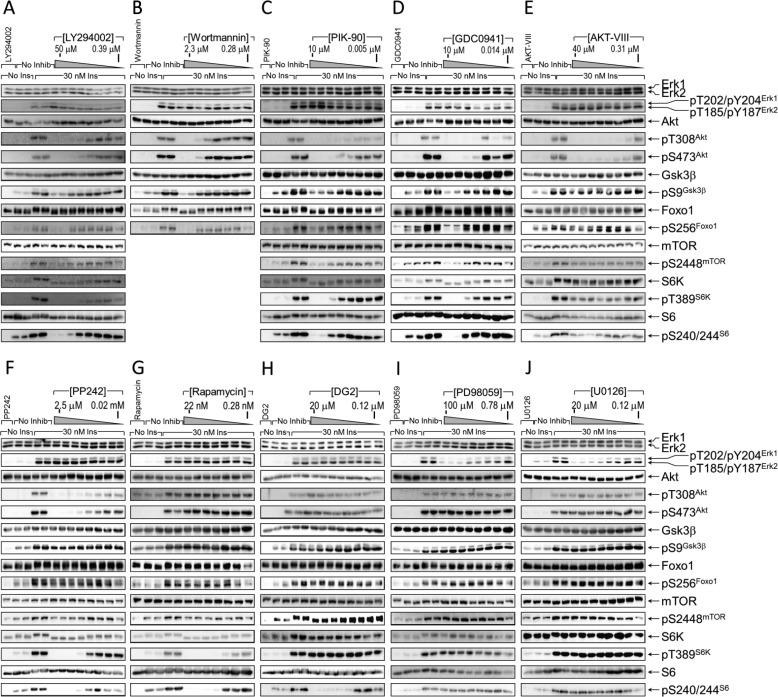
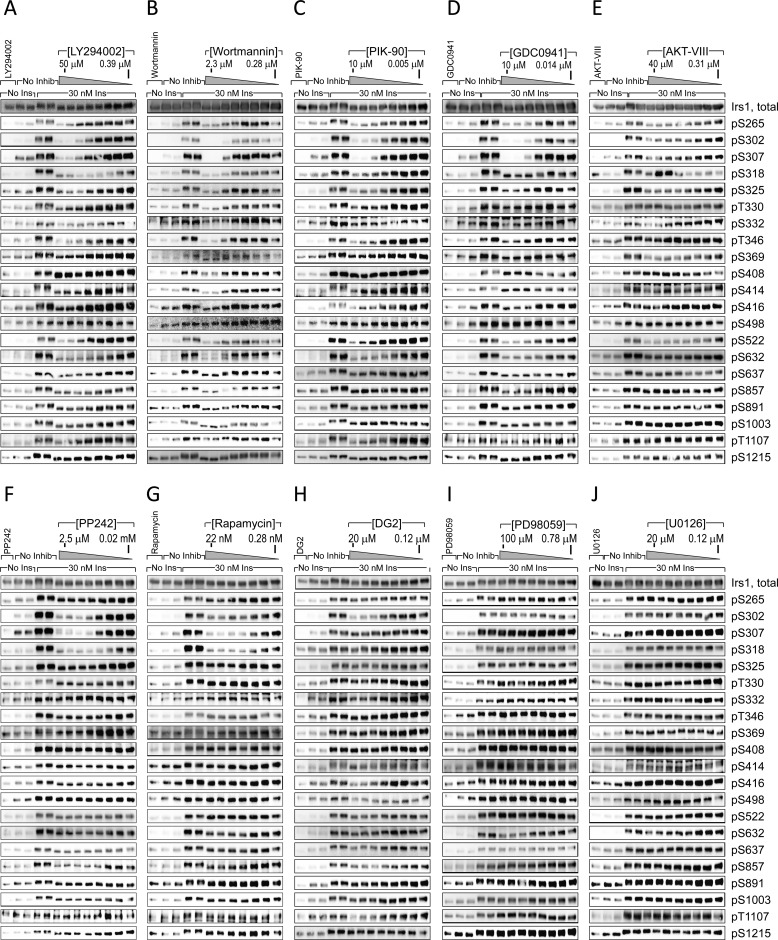
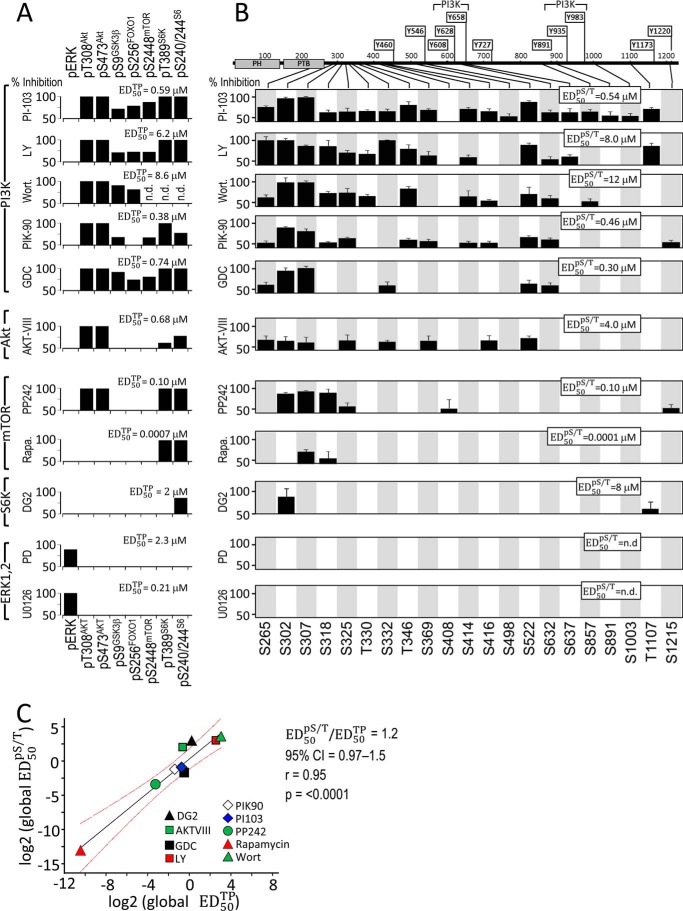
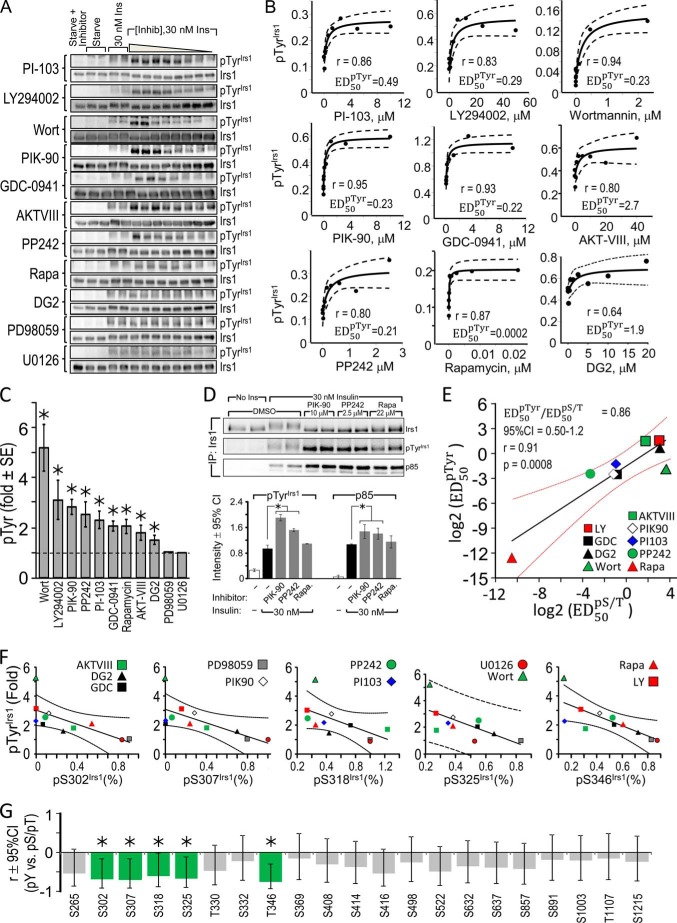
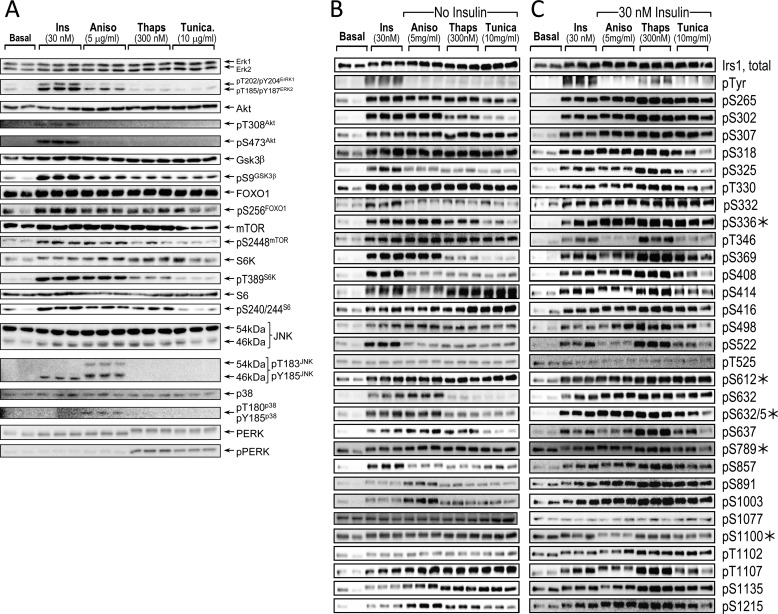
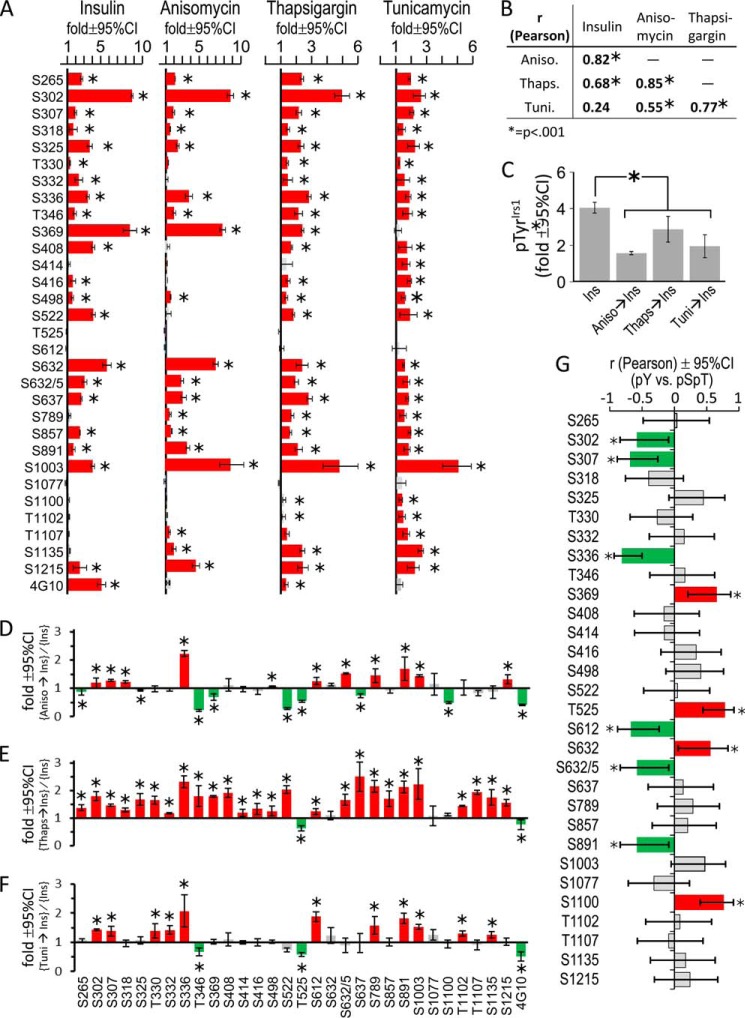
IRS1 and IRS2 are key substrates of the insulin receptor tyrosine kinase. Mass spectrometry reveals more than 50 phosphorylated IRS1 serine and threonine residues (Ser(P)/Thr(P) residues) in IRS1 from insulin-stimulated cells or human tissues. We investigated a subset of IRS1 Ser(P)/Thr(P) residues using a newly developed panel of 25 phospho-specific monoclonal antibodies (αpS/TmAb(Irs1)). CHO cells overexpressing the human insulin receptor and rat IRS1 were stimulated with insulin in the absence or presence of inhibitors of the PI3K → Akt → mechanistic target of rapamycin (mTOR) → S6 kinase or MEK pathways. Nearly all IRS1 Ser(P)/Thr(P) residues were stimulated by insulin and significantly suppressed by PI3K inhibition; fewer were suppressed by Akt or mTOR inhibition, and none were suppressed by MEK inhibition. Insulin-stimulated Irs1 tyrosine phosphorylation (Tyr(P)(Irs1)) was enhanced by inhibition of the PI3K → Akt → mTOR pathway and correlated with decreased Ser(P)-302(Irs1), Ser(P)-307(Irs1), Ser(P)-318(Irs1), Ser(P)-325(Irs1), and Ser(P)-346(Irs1). Metabolic stress modeled by anisomycin, thapsigargin, or tunicamycin increased many of the same Ser(P)/Thr(P) residues as insulin, some of which (Ser(P)-302(Irs1), Ser(P)-307(Irs1), and four others) correlated significantly with impaired insulin-stimulated Tyr(P)(Irs1). Thus, IRS1 Ser(P)/Thr(P) is an integrated response to insulin stimulation and metabolic stress, which associates with reduced Tyr(P)(Irs1) in CHO(IR)/IRS1 cells.

Keywords: CHO Cells; Cell Signaling; IRS1; Insulin Resistance; Insulin Signaling; Metabolic Stress; Monoclonal Antibodies; Phosphotyrosine Signaling; Protein Phosphorylation; Signal Transduction.


Figures

FIGURE 1.
FIGURE 1.
Validation of monoclonal antibodies (αpS/TmAbIrs1) generated against MS/MS-identified Irs1 phosphopeptides (19). A, Irs1 Ser(P)/Thr(P) residues (rat, mouse, and human numbering) and their surrounding amino acid sequences (phosphopeptide, phosphorylated residue in red) used for mAb production. The Akt motifs were identified at a medium threshold by GPS 3.0 using rat Irs1 (CAA41264) as the target (91). The ratio of score to cutoff (S/C) is reported. B, the sequence specificity of each αpS/TmAbIrs1 was verified in an ELISA assay against 15-residue phosphopeptides based upon the seven amino- and carboxyl-terminal residues surrounding the Ser(P)/Thr(P) of interest in rat Irs1. C, CHO cell lines expressing human insulin receptor and either wild type or mutant (A307) rat Irs1 were serum-starved overnight and then stimulated with 30 nm insulin for 30 min. Extracts were blotted with total Irs1 and αpS307Irs1 antibodies. D, CHOIR/Irs1 cells were treated with 30 nm insulin for 30 min. Irs1 was immunoblotted with the indicated αpS/TmAbIrs1; each column represents a separate cell extract, with the same extract being used for each antibody in that column.
FIGURE 2.
FIGURE 2.
Nearly global inhibition of insulin-stimulated Irs1 S/T phosphorylation by PI3K inhibitor PI-103. CHOIR/Irs1 cells were treated without or with PI-103 (0.078 μm or 0.156, 0.312, 0.625, 1.25, 2.50, 5.00, or 10.0 mm) for 30 min before insulin (30 nm) treatment. A and B, cell extracts were immunoblotted with total or phospho-specific target protein antibodies (A) or total Irs1 and each αpS/TmAbIrs1 (B). C, insulin-stimulated Ser/Thr phosphorylation in the presence of PI-103 was normalized by the intensity measured in the absence of PI-103. The normalized response was fitted to an hyperbolic curve, f(x) = y0 · (kid + x · kin)/(kid + x). For each Ser(P)/Thr(P), the maximal inhibition (%I) by PI-103 and the square of the correlation coefficient (r2) are indicated; blue dotted lines indicate the 95% confidence interval of the fitted curve. Curves with r2 > 0.7 and %I > 50 are taken to indicate a reportable effect. No Inhib, no inhibition; No Ins, no insulin; Ins, insulin.
FIGURE 3.
FIGURE 3.
Inhibition of insulin-stimulated Ser/Thr kinase pathways. A–J, CHOIR/Irs1 cells were treated for 30 min without or with the indicated kinase inhibitor at concentrations increasing sequentially 2-fold between the boundaries shown on each figure. Then the cells were treated with insulin (30 min, 30 nm), and the cleared lysates were immunoblotted with the indicated antibodies. The bands were quantified on a Kodak Image Station 4000MM Pro, and the data were analyzed using Carestream Molecular Imaging software version 5.0. No Inhib, no inhibition; No Ins, no insulin; Ins, insulin.
FIGURE 4.
FIGURE 4.
Effect upon insulin-stimulated Irs1 Ser(P)/Thr(P) following inhibition of insulin-stimulated Ser/Thr kinase pathways. A–J, CHOIR/Irs1 cells were pretreated with the indicated kinase inhibitors for 30 min before insulin stimulation (30 nm) for an additional 30 min. Cleared lysates were subject to immunoblotting with the indicated αpS/TmAbIrs1 to determine the effect upon Irs1 Ser/Thr phosphorylation. The bands were quantified on a Kodak Image Station 4000MM Pro, and the data were analyzed using Carestream Molecular Imaging software version 5.0. No Inhib, no inhibition; No Ins, no insulin; Ins, insulin.
FIGURE 5.
FIGURE 5.
Inhibitors of insulin-stimulated Ser/Thr kinases have similar effects upon known inhibitor target proteins and Irs1 Ser(P)/Thr(P) residues. CHOIR/Irs1 cells were treated with the indicated kinase inhibitors (concentration ranges in Fig. 3) for 30 min before insulin stimulation (30 nm, 30 min), and the cleared cell extracts were analyzed on immunoblots (shown in Fig. 3 and Fig. 4). Insulin-stimulated phosphorylation in the presence of each inhibitor was normalized to that measured in its absence, and the normalized data were fitted to f(x) = y0 · (kid + x · kin)/(kid + x) to assay significant inhibition (%I). Individual target protein or Ser(P)/Thr(P) residues that reached the cutoffs (%I > 50; r2 > 0.7) are shown as black bars. A, the global ED50TP (ED50 for inhibition of target proteins) was determined for each inhibitor by fitting the data for the target proteins simultaneously. B, the sets of Irs1 Ser(P)/Thr(P) residues significantly inhibited by each compound (black bars) were analyzed in a similar way to determine the global ED50pS/T. C, linear regression of the global ED50pS/T (log2) on the global ED50TP (log2) values determined for each inhibitor. The slope of the line is the ratio of ED50 values. Red lines show the 95% confidence interval of the fitted line. Wort., wortmannin; LY, LY294002; Rapa., rapamycin.
FIGURE 6.
FIGURE 6.
Inhibition of insulin-stimulated Ser/Thr kinases enhances insulin-stimulated Tyr(P)Irs1. A, Tyr(P)Irs1 determined in CHOIR/Irs1 cells treated with kinase inhibitors. Cells were treated for 30 min without or with the indicated kinase inhibitor at concentrations increasing sequentially 2-fold between the boundaries shown in Fig. 4 before incubation with insulin (30 nm, 30 min). Cleared lysates were subject to immunoblotting with antibodies against Irs1 or Tyr(P). The bands were quantified on a Kodak Image Station 4000MM Pro, and the data were analyzed using Carestream Molecular Imaging software version 5.0. B, the insulin-stimulated Tyr(P)Irs1 at each inhibitor concentration was normalized to that observed in the absence of inhibitor, and the normalized data were fitted to f(x) = y0 · (kid + x · kin)/(kid + x) to determine the maximal fold enhancement of Tyr(P)Irs1 and ED50pTyr. Dotted lines show the 95% confidence interval of the fitted curves. C, calculated maximal fold enhancement of insulin-stimulated Tyr(P)Irs1 by each kinase inhibitor. Error bars show 95% confidence interval. *, p < 0.05. D, CHOIR/Irs1 cells were treated without or with inhibitors PIK-90, PP242, or rapamycin for 30 min before insulin stimulation (30 nm, 30 min). Lysates were immunoprecipitated with total Irs1 monoclonal antibody and immunoblotted with antibodies against Irs1, Tyr(P), or the p85 subunit of PI3K. The bands were quantified on a Kodak Image Station 4000MM Pro, and the data were analyzed using Carestream Molecular Imaging software version 5.0. The average signals (± S.D.) in the absence or presence of kinase inhibitors for three separate experiments are shown; *, p < 0.05. E, linear regression of the ED50pTyr (log2) on the global ED50pS/T (log2) values determined for each inhibitor; the slope of the line is the ratio of ED50 values (± 95% confidence interval in red). F, Pearson correlation (r ± 95% confidence interval) establishing inverse relation between the maximal inhibition (%I) of particular Irs1 Ser(P)/Thr(P) and stimulation (fold) of Tyr(P)Irs1 determined from kinase inhibitor data. G, summary of Pearson correlation for all assayed Ser(P)/Thr(P) residues. Green bars highlight significant (p < 0.05) negative r, indicating Irs1 Ser(P)/Thr(P) residues associated with reduced Tyr(P)Irs1; gray bars are not significant. Inhib, inhibition; Ins, insulin; Wort, wortmannin; CI, confidence interval; IP, immunoprecipitation; Rapa, rapamycin.
FIGURE 7.
FIGURE 7.
Stimulation of Ser/Thr kinases and Irs1 Ser(P)/Thr(P) residues by insulin or agonists of metabolic stress. A, serum-starved CHOIR/Irs1 cells were left untreated (Basal), or treated with insulin (30 nm, 30 min), anisomycin (5 μg/ml, 60 min), thapsigargin (300 nm, 180 min), or tunicamycin (10 μg/ml, 180 min). The cleared lysates were immunoblotted with antibodies against total protein or the indicated phosphospecific antibodies. B, the lysates in A were immunoblotted with antibodies to total Irs1, Tyr(P), and 25 αpS/TmAbIrs1 plus five commercially available Irs1 phosphospecific polyclonal antibodies (*). C, CHOIR/Irs1 cells were treated as in A, but with the subsequent addition of insulin (30 nm, 30 min) to those cells treated with anisomycin, thapsigargin, or tunicamycin. Bands were quantified on a Kodak Image Station 4000MM Pro, and the data were analyzed using Carestream Molecular Imaging software version 5.0. Ins, insulin; Aniso, anisomycin; Thaps, thapsigargin; Tunica, tunicamycin.
FIGURE 8.
FIGURE 8.
The effect of metabolic stress upon basal and insulin-stimulated Irs1 phosphorylation. A, CHOIR/Irs1 cells were treated with insulin (30 nm, 30 min), anisomycin (5 μg/ml, 60 min), thapsigargin (300 nm, 3 h), or tunicamycin (10 μg/ml, 60 min). Irs1 Ser(P)/Thr(P) residues stimulated by insulin or agonists of metabolic stress (blots in Fig. 7B) were quantified and normalized to the phosphorylation in untreated CHOIR/Irs1 cells to determine the fold stimulation (± 95% confidence interval) above basal. Red bars indicate significant stimulation (*, p < 0.05); gray bars are not significant. B, Pearson correlation (r) of insulin- and metabolic stress-induced Irs1 Ser(P)/Thr(P) patterns shown in A. C, fold (versus basal) Tyr(P)Irs1 stimulated by insulin alone (30 nm, 30 min) or by insulin preceded by anisomycin (5 μg/ml, 60 min), thapsigargin (300 nm, 3 h), or tunicamycin (10 μg/ml, 60 min) treatment. D–F, the Irs1 Ser(P)/Thr(P) residues stimulated by insulin alone or insulin preceded by metabolic stress (blots in Fig. 7C) were quantified, normalized to the basal phosphorylation in untreated cells, and expressed as the ratio (metabolic stress plus insulin)/(insulin alone) (fold ± 95% confidence interval). Red bars indicate significantly greater Ser/Thr phosphorylation in cells pretreated with the indicated agent, and green bars significantly less (*, p < 0.05). G, Pearson correlation (r ± 95% confidence interval) of Irs1 Ser(P)/Thr(P) residues in cells treated with insulin, or with anisomycin, thapsigargin, or tunicamycin followed by insulin, with the fold insulin-stimulated Tyr(P)Irs1 observed under these conditions; green bars indicate Ser(P)/Thr(P) residues that correlate significantly with less Tyr(P)Irs1; red bars indicate Ser(P)/Thr(P) residues that correlate significantly with more Tyr(P)Irs1 (*, p < 0.05); gray bars are not significant. Ins, insulin; Aniso, anisomycin; Thaps, thapsigargin; Tuni, tunicamycin; CI, confidence interval.

Similar articles

Cited by

References

    1. Reaven G. (2004) The metabolic syndrome or the insulin resistance syndrome?: different names, different concepts, and different goals. Endocrinol. Metab. Clin. North Am. 33, 283–303 - PubMed
    1. Biddinger S. B., Kahn C. R. (2006) From mice to men: insights into the insulin resistance syndromes. Annu. Rev. Physiol. 68, 123–158 - PubMed
    1. DeFronzo R. A., Tripathy D. (2009) Skeletal muscle insulin resistance is the primary defect in type 2 diabetes. Diabetes Care 32, S157–S163 - PMC - PubMed
    1. Karlsson H. K., Zierath J. R. (2007) Insulin signaling and glucose transport in insulin resistant human skeletal muscle. Cell Biochem. Biophys. 48, 103–113 - PubMed
    1. Samuel V. T., Shulman G. I. (2012) Mechanisms for insulin resistance: common threads and missing links. Cell 148, 852–871 - PMC - PubMed

Publication types

MeSH terms

LinkOut - more resources