. 2014 May 9;289(19):13197-205.
doi: 10.1074/jbc.M113.526301. Epub 2014 Mar 20.

The N-terminal domain modulates α-amino-3-hydroxy-5-methyl-4-isoxazolepropionic acid (AMPA) receptor desensitization

Affiliations

The N-terminal domain modulates α-amino-3-hydroxy-5-methyl-4-isoxazolepropionic acid (AMPA) receptor desensitization

Tommi Möykkynen et al. J Biol Chem. .

Abstract

AMPA receptors are tetrameric glutamate-gated ion channels that mediate fast synaptic neurotransmission in mammalian brain. Their subunits contain a two-lobed N-terminal domain (NTD) that comprises over 40% of the mature polypeptide. The NTD is not obligatory for the assembly of tetrameric receptors, and its functional role is still unclear. By analyzing full-length and NTD-deleted GluA1-4 AMPA receptors expressed in HEK 293 cells, we found that the removal of the NTD leads to a significant reduction in receptor transport to the plasma membrane, a higher steady state-to-peak current ratio of glutamate responses, and strongly increased sensitivity to glutamate toxicity in cell culture. Further analyses showed that NTD-deleted receptors display both a slower onset of desensitization and a faster recovery from desensitization of agonist responses. Our results indicate that the NTD promotes the biosynthetic maturation of AMPA receptors and, for membrane-expressed channels, enhances the stability of the desensitized state. Moreover, these findings suggest that interactions of the NTD with extracellular/synaptic ligands may be able to fine-tune AMPA receptor-mediated responses, in analogy with the allosteric regulatory role demonstrated for the NTD of NMDA receptors.

Keywords: Allosteric Regulation; Ion Channels; Ionotropic Glutamate Receptors (AMPA, NMDA); Protein Domains; Receptor Desensitization; Receptor Structure-Function.


Figures
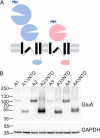
FIGURE 1.
FIGURE 1.
Expression of the full-length and NTD-deleted AMPA receptors. A, schematic of the full-length (blue) and NTD-deleted (red) subunits. All constructs used in the study have an extracellular, N-terminal FLAG tag fused just prior to the start of the AMPA receptor polypeptide. B, immunoblot analysis of transfected HEK293 cell extracts. Total protein loaded was 18 μg for all samples. Top panel, probed anti-FLAG IgG detecting the AMPA receptor proteins. Bottom panel, probed anti-GAPDH as a loading control. The NTD-deleted subunits show stronger expression than their corresponding full-length proteins.
FIGURE 2.
FIGURE 2.
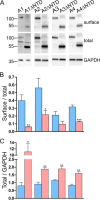
Efficiency of surface expression of full-length and NTD-deleted AMPA receptors in transfected HEK293 cells. A, immunoblot analyses showing the receptor levels on cell surface (top row) and in the total cell extract (center row). Plasma membrane expression was analyzed by using a surface biotinylation assay. The samples were probed by using the appropriate C-terminal domain-specific antibodies. Bottom row, GAPDH immunoreactivity in the same cell extracts, serving as a loading control and for signal normalization. Positions of molecular size markers are shown on the left. B, quantitation of relative surface expression levels. *, p < 0.05; **, p < 0.01; ***, p < 0.001. C, quantitation of relative total expression levels. **, p < 0.01. B and C, data are mean ± S.E. (n = 4) for the full-length and NTD-deleted receptors. The bar graphs correspond to the samples in A.
FIGURE 3.
FIGURE 3.
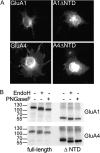
Cellular distribution and glycosylation status of full-length and NTD-deleted GluA1 and GluA4 receptors. A, representative micrographs showing the distribution of FLAG immunofluorescence in transfected COS7 cells. The staining was performed in fixed cells permeabilized with Triton X-100. B, immunoblot analysis showing the sensitivity of the glycosylated receptors to endoglycosidase H and PNGase F. Immunoprecipitated receptors were treated with enzymes as indicated at the top and analyzed by FLAG immunoblotting. Positions of molecular size markers are shown on the left.
FIGURE 4.
FIGURE 4.
Deletion of the NTD increases steady-state glutamate responses. A, overlapping recording traces of 10 mm glutamate evoked currents of full-length (blue) and ΔNTD (red) GluA1-A4 AMPA receptors. The black horizontal bar indicates the glutamate application. The scale bar under the A1 trace applies to all full-length subunit receptors. The currents of ΔNTD receptors are scaled to the currents of wild types, and their amplitude is indicated by a red vertical scale bar. Top row, whole recordings. Bottom row, enlarged peak currents to illustrate the differences in the width of peak currents. B, the steady state/peak current ratios of full-length (blue) and ΔNTD (red) AMPA receptors. The number of independent measurements is 20 (A1), 16 (A1ΔNTD), 23 (A2), 11 (A2ΔNTD), 12 (A3), 15 (A3ΔNTD), 24 (A4), and 26 (A4ΔNTD). **, p < 0.01 (p = 0.0024), ***, p < 0.001, the difference between the full-length and ΔNTD.
FIGURE 5.
FIGURE 5.
The NTD modulates the desensitization kinetics of AMPA receptors. A, τ values of desensitization measured from the decay of the peak current of full-length (blue) and ΔNTD (red) AMPA receptors. The box extends from the 25th percentile to the 75th percentile with a line at the medial (50th) percentile. The whiskers indicate the lowest and highest values. The numbers of independent measurements were 29 (A1), 20 (A1ΔNTD), 21 (A2), 12 (A2ΔNTD), 13 (A3), 15 (A3ΔNTD), 24 (A4), and 26 (A4ΔNTD). ***, p < 0.001, Student's t test. B, τ values of recovery from desensitization of A1-A4 full-length receptors (light blue) and ΔNTDs (light red). The left y axis is for A1 alone and the right is for A2-A4. Error bars indicate a 95% confidence interval (n = 10–16). The numbers of independent measurements were 10 (A1, A1ΔNTD, A2ΔNTD, and A4ΔNTD), 16 (A2 and A3), 13 (A3ΔNTD), and 11 (A4). C, overlapping recording traces of a single recovery from a desensitization experiment for full-length (blue) and ΔNTD (red) GluA1 AMPA receptors. The traces of ΔNTD are scaled to the same level as full-length receptors. D, curves of averaged recovery from desensitization experiments of the WT (light blue) and ΔNTD (light red) GluA1 subunit. Data are mean ± S.E. The y axis is the ratio of the amplitude of the second and first peak current.
FIGURE 6.
FIGURE 6.
NTD removal increases cytotoxicity. A, quantification of cell death following transfection and expression of the indicated receptors. Blue bars, full-length receptors; red bars, NTD-deleted receptors; HEK, control cells incubated with transfection reagents but no DNA; hatched bars, presence of NBQX in the culture medium. Error bars indicate mean ± S.E. (n = 6–12). * (p < 0.05) and ** (p < 0.01) indicate the levels of significance in the statistical difference in LDH release between the NTD-deleted and its corresponding full-length receptors. The actual values are: GluA1, p = 0.0074; GluA2(Q), p < 0.0001; GluA2(R); p = 0.473. B, typical micrographs showing the effect on the cell population following the expression of the indicated receptors. HEK293, cells incubated with transfection reagents but no DNA. Scale bar = 400 μm. C, analysis of cell surface expression of GluA2(R) and GluA2(R)ΔNTD. The immunoblot analysis (left panel) shows the surface and total expression in a typical experiment, and the bar graphs (right panel) represent the quantitation of data from four experiments performed as in Fig. 2. **, p < 0.01.
FIGURE 7.
FIGURE 7.
The NTD regulates AMPA receptor desensitization. Shown is a schematic illustrating the resting (R), active (A), and ligand-bound and desensitized (D) states of the AMPA receptor. Desensitization is depicted as a separation of LBD dimers. The NTD dimers exert force on the LBD to promote dimer separation (arrows). NTDs are orange/red shapes, LBDs are blue circles, membrane domains are blue rectangles, and ligands are green ovals.

Similar articles

Cited by

References

    1. Palmer C. L., Cotton L., Henley J. M. (2005) The molecular pharmacology and cell biology of α-amino-3-hydroxy-5-methyl-4-isoxazolepropionic acid receptors. Pharmacol. Rev. 57, 253–277 - PMC - PubMed
    1. Collingridge G. L., Olsen R. W., Peters J., Spedding M. (2009) A nomenclature for ligand-gated ion channels. Neuropharmacology 56, 2–5 - PMC - PubMed
    1. Traynelis S. F., Wollmuth L. P., McBain C. J., Menniti F. S., Vance K. M., Ogden K. K., Hansen K. B., Yuan H., Myers S. J., Dingledine R. (2010) Glutamate receptor ion channels: structure, regulation, and function. Pharmacol. Rev. 62, 405–496 - PMC - PubMed
    1. Clayton A., Siebold C., Gilbert R. J., Sutton G. C., Harlos K., McIlhinney R. A., Jones E. Y., Aricescu A. R. (2009) Crystal structure of the GluR2 amino-terminal domain provides insights into the architecture and assembly of ionotropic glutamate receptors. J. Mol. Biol. 392, 1125–1132 - PubMed
    1. Jin R., Singh S. K., Gu S., Furukawa H., Sobolevsky A. I., Zhou J., Jin Y., Gouaux E. (2009) Crystal structure and association behaviour of the GluR2 amino-terminal domain. EMBO J. 28, 1812–1823 - PMC - PubMed

Publication types

MeSH terms

Substances

LinkOut - more resources