. 2014 May;247(5):395-408.
doi: 10.1007/s00232-014-9646-z. Epub 2014 Mar 21.

Continuum approaches to understanding ion and peptide interactions with the membrane

Affiliations

Continuum approaches to understanding ion and peptide interactions with the membrane

Naomi R Latorraca et al. J Membr Biol. 2014 May.

Abstract

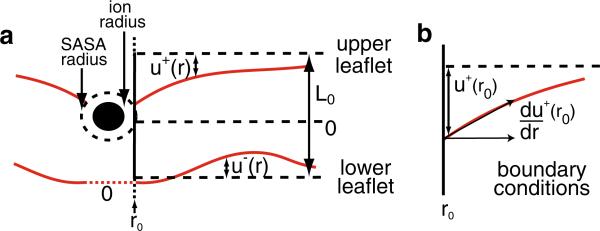
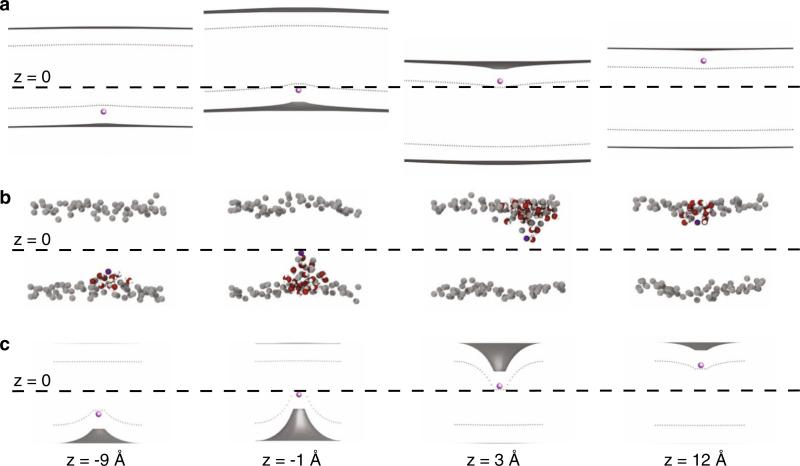
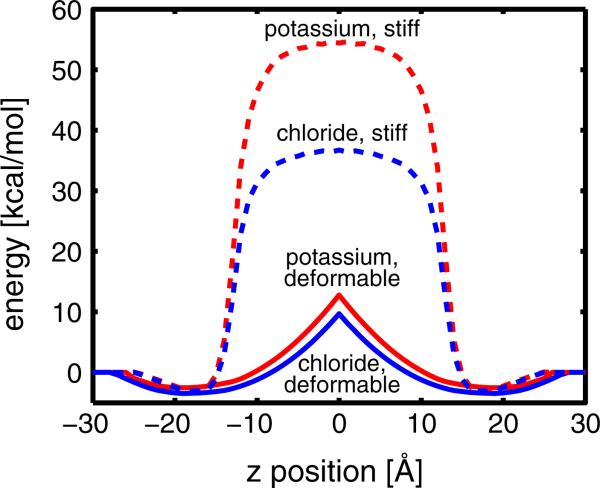
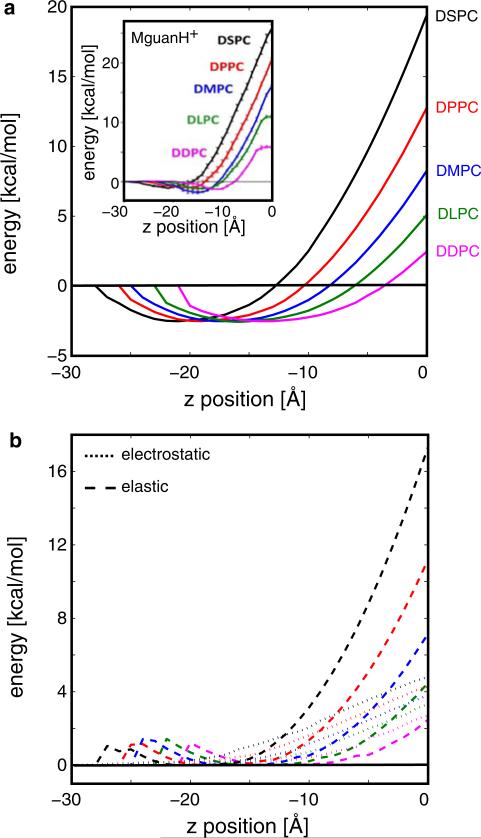
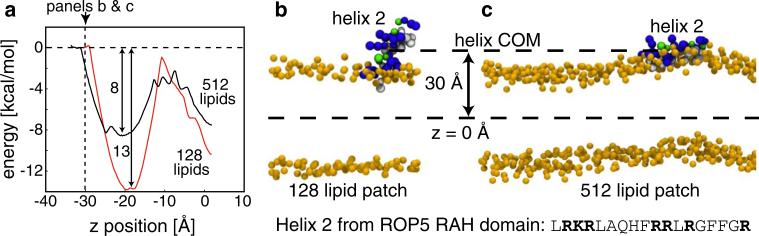
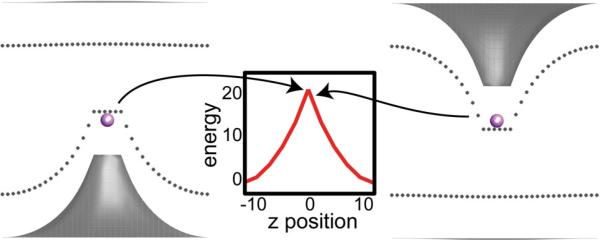
Experimental and computational studies have shown that cellular membranes deform to stabilize the inclusion of transmembrane (TM) proteins harboring charge. Recent analysis suggests that membrane bending helps to expose charged and polar residues to the aqueous environment and polar head groups. We previously used elasticity theory to identify membrane distortions that minimize the insertion of charged TM peptides into the membrane. Here, we extend our work by showing that it also provides a novel, computationally efficient method for exploring the energetics of ion and small peptide penetration into membranes. First, we show that the continuum method accurately reproduces energy profiles and membrane shapes generated from molecular simulations of bare ion permeation at a fraction of the computational cost. Next, we demonstrate that the dependence of the ion insertion energy on the membrane thickness arises primarily from the elastic properties of the membrane. Moreover, the continuum model readily provides a free energy decomposition into components not easily determined from molecular dynamics. Finally, we show that the energetics of membrane deformation strongly depend on membrane patch size both for ions and peptides. This dependence is particularly strong for peptides based on simulations of a known amphipathic, membrane binding peptide from the human pathogen Toxoplasma gondii. In total, we address shortcomings and advantages that arise from using a variety of computational methods in distinct biological contexts.


Figures

Fig. 1
Fig. 1
Geometry of the system in the continuum model. a Cross section showing membrane distortions in the upper and lower leaflets. Solid red lines indicate the membrane–water interfaces. Dashed black lines indicate the equilibrium heights of the membrane leaflets and the midplane at z = 0. u+ and u represent the displacement from equilibrium for the upper and lower leaflets, respectively. The equilibrium bilayer thickness is L0. The inner boundary conditions are applied at r0, where the solvent accessible surface area (SASA) of the ion contacts the membrane. b The contact point u+(r0) is determined from the search angle that minimizes the total energy Eq. 1. The ion–membrane contact angle, du+/dr, is a free parameter in the model that is optimized during energy minimization. The contact point and angle on the lower leaflet are treated in similar manners (Color figure online)
Fig. 2
Fig. 2
Continuum membrane bending is qualitatively similar to deformations observed in coarse-grained simulations. a Configurations from the continuum membrane bending model for a large patch of membrane with boundary conditions applied at 800 Å from the ion. Panels a–c all show four snapshots of a cation (purple) placed at –9, –1, +3, and +12 Å with respect to the center of mass of the membrane. In panels a and c, the gray surfaces are the membrane–water interfaces, which separate the head group region from aqueous solution. The interfaces between the head group region and the membrane core are shown as gray dotted curves. A search was carried out to identify the optimum membrane shape that minimizes the system energy for each ion position. The membrane undergoes large deflections in the z direction to avoid penetration of the ion into the hydrocarbon core. These deflections are most pronounced when the ion is near the center at z = –1 and +3 Å causing shifts up and down, respectively. When the ion is at –9 and +12 Å the bilayer undergoes very little deflection from the flat, unstrained state. b Snapshots from a coarse-grained MD simulation of Na+ penetrating a DPPC bilayer using the MARTINI forcefield. The membrane is approximately square with a side length of 65 Å, and it is composed of 128 DPPC lipids. The phosphate beads are gray, and penetrating waters are red and white. Starting with an identical flat, equilibrated bilayer, 71 independent umbrella sampling simulations were performed with the ion restrained at positions along the membrane normal. The small leaflet deformations occur at –9 and +12 Å, but large membrane bending occurs when the ion is near the center of the bilayer in the middle two snapshots. c Configurations from the continuum model for a small patch of membrane with a 19.5 Å radius. For this small patch, more similar in size to the system in panel b, the membrane is not able to adopt a low energy, large scale deformation to avoid penetration by the ion. The leaflet being penetrated bends sharply, while the opposite leaflet adopts a more gentle bend to relieve compression just as in the coarse-grained simulations in panel b (Color figure online)
Fig. 3
Fig. 3
Free energy profiles along the transmembrane coordinate for a cation and an anion. We translated K+ (red curves) or Cl (blue curves) across the membrane in 1 Å steps with the ion initially positioned in bulk solvent approximately 6 Å from the membrane–water interface (z = –30 Å). Dashed lines correspond to calculations carried out on a stiff, unbending bilayer, while solid lines correspond to calculations carried out using the membrane bending model and minimizing the total energy in Eq. 1. Bending dramatically reduces the energy required to move ions into the center of the membrane by 12–30 kcal/mol. The membrane dipole reduces Cl penetration by ~20 kcal/mol over K+ in the non-deformable model (difference between dashed curves), but only by 2–3 kcal/mol in the membrane bending model (difference between solid curves) because ions never experience the full dipole potential in the later case (Color figure online)
Fig. 4
Fig. 4
Free energy profiles for K+ penetration into bilayers of different thicknesses. a For all thicknesses, the ion is stabilized as it enters the head group region, but rises to a sharp-peak at the membrane center. The penetration energy increases with membrane thickness with values at the center ranging from 3 to 18 kcal/mol. The inset shows similar free energy profiles obtained from atomistic MD simulations carried out on the positively charged arginine side chain analogue, MGuanH+ (Li et al. 2012). The equilibrium thickness (L0) and bending modulus (Kc) were increased to match the known properties of lipids being modeled, and values are given in Table 2. The compression modulus (Ka) was held constant since it is thought to be independent of the hydrophobic thickness. In all cases, L0 for each lipid type is similar between the MD simulations and continuum model except for DSPC, as discussed in the “Methods” section. b Elastic (dashed) and electrostatic (dotted) energy contributions to the insertion energy values in panel a. The color scheme is the same as panel a. As the ion first enters the head group between –28 and –22 Å, depending on the lipid type, there is a small jump in the bending energy due to the bilayer bending up to meet the ion. Near the center of the bilayer, the elastic energy term dominates for thicker bilayers, but the elastic and electrostatic components are similar for thinner bilayers. The nonpolar energy term is not shown since it is relatively simple: it decreases by a set amount as the ion penetrates the head group, and then it remains flat
Fig. 5
Fig. 5
Free energy of ROP5 RAH helix 2 binding to a membrane. a The potential of mean force (PMF) for ROP5 RAH helix 2 translated from the lower bath into the center of the bilayer. The PMFs are flat in water, but exhibit a sharp downward slope at –32 Å (512 patch, black curve) and –28 Å (128 patch, red curve) when the membrane starts to bend to interact with the helix. The large patch is able to bend to reach the helix before the small patch leading to robust differences between the two PMFs. The interfacial region near –20 Å is the most stable position for both simulations, but the binding is predicted to be 5 kcal/mol more stable for the small patch than the large patch. The interface between the head group and aqueous environment in the unstrained membrane is indicated by the vertical dashed line. b, c Significant membrane deformations are observed in the large coarse-grained system, but not the small system. When helix 2 from the ROP5 protein is restrained at ±30, +30 Åis shown here, from the center of a DPPC bilayer, a large membrane patch is able to undergo a large scale conformational change to allow the helix to go completely interfacial (c), while the small patch is unable to accommodate such a bending mode (b). Only the distance from the helix COM to the membrane COM are restrained, and the orientation of the helix is free to rotate. Without membrane bending, the distance restraint prevents the entire helix from embedding in the membrane interface (b). These differences in system size give rise to differences in the energetics of helix association with the membrane in panel a (Color figure online)
Fig. 6
Fig. 6
The continuum model fails to reproduce the transition state for ion permeation. Membrane configurations from the continuum model for a K+ at the center of the membrane (left) and just to the right of the membrane center (right). The relevant portion of the energy profile from Fig. 3 is shown in the middle

Similar articles

Cited by

References

    1. Baker NA, Sept D, Joseph S, Holst MJ, McCammon JA. Electrostatics of nanosystems: application to microtubules and the ribosome. Proc Natl Acad Sci USA. 2001;98(18):10037–10041. - PMC - PubMed
    1. Behnke MS, Khan A, Wootton JC, Dubey JP, Tang K, Sibley LD. Virulence differences in Toxoplasma mediated by amplification of a family of polymorphic pseudokinases. Proc Natl Acad Sci USA. 2011;108(23):9631–9636. - PMC - PubMed
    1. Bennett WD, Tieleman DP. Water defect and pore formation in atomistic and coarse-grained lipid membranes: pushing the limits of coarse graining. J Chem Theory Comput. 2011;7(9):2981–2988. - PubMed
    1. Berendsen HJC, Postma JPM, van Gunsteren WF, DiNola A, Haak JR. Molecular dynamics with coupling to an external bath. J Chem Phys. 1984;81(8):3684. doi:10.1063/1.448118.
    1. Bond PJ, Wee CL, Sansom MS. Coarse-grained molecular dynamics simulations of the energetics of helix insertion into a lipid bilayer. Biochemistry. 2008;47(43):11321–11331. - PubMed

Publication types