. 2014 Jun;23(6):769-89.
doi: 10.1002/pro.2460. Epub 2014 May 3.

Membrane protein stability can be compromised by detergent interactions with the extramembranous soluble domains

Affiliations

Membrane protein stability can be compromised by detergent interactions with the extramembranous soluble domains

Zhengrong Yang et al. Protein Sci. 2014 Jun.

Abstract

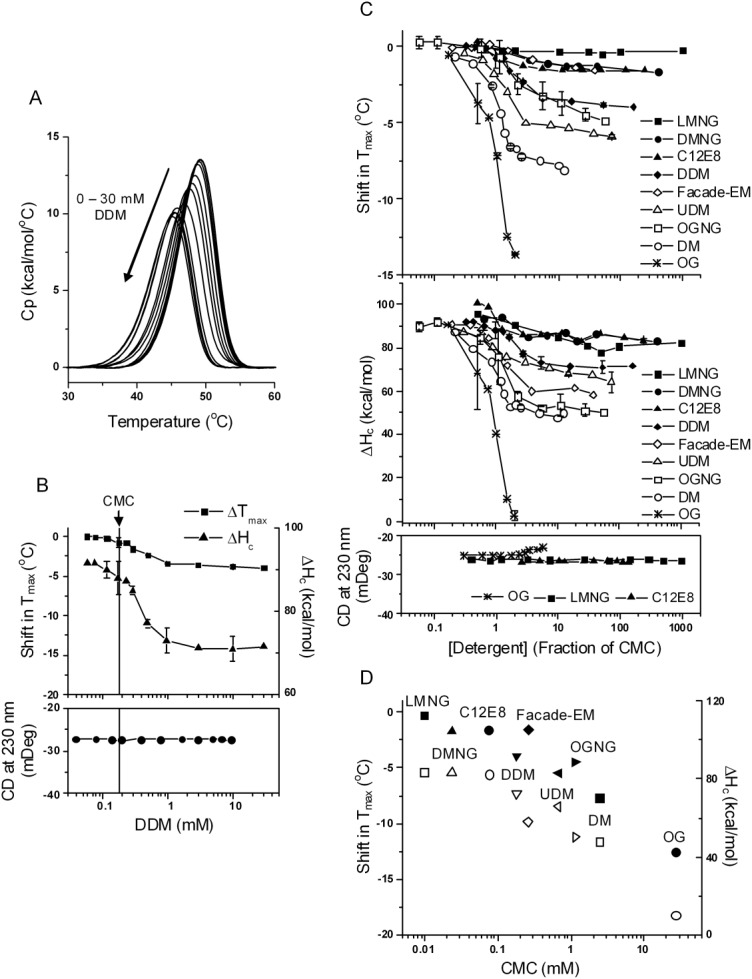
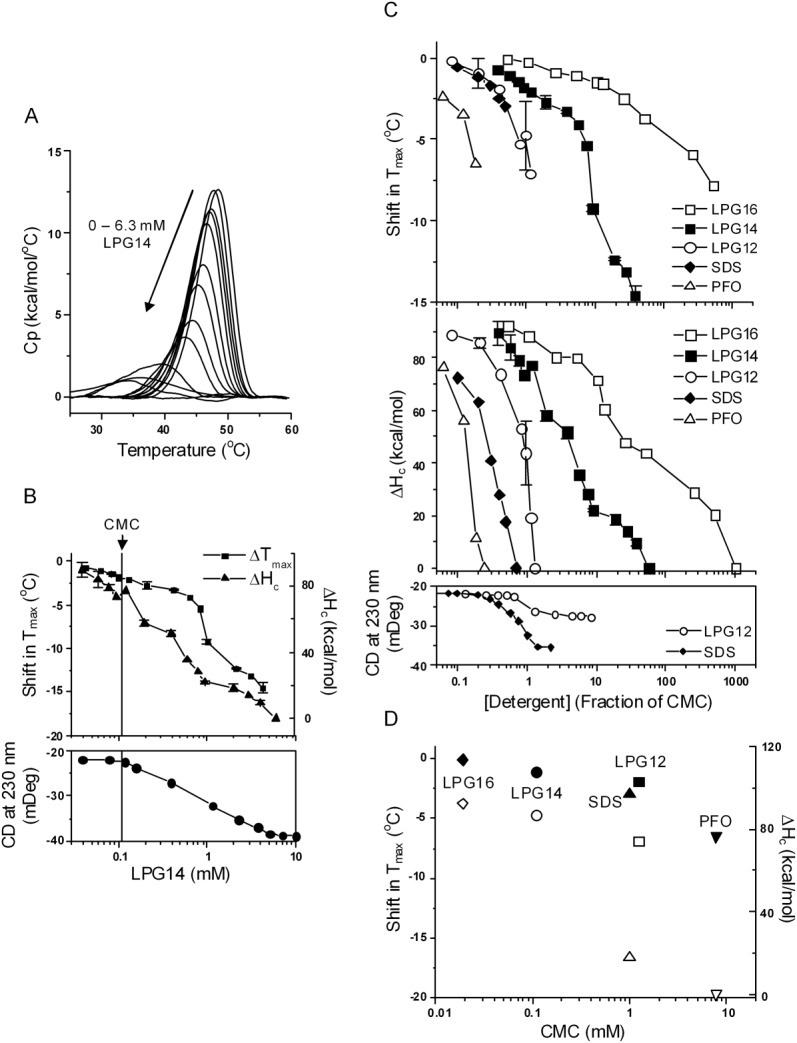
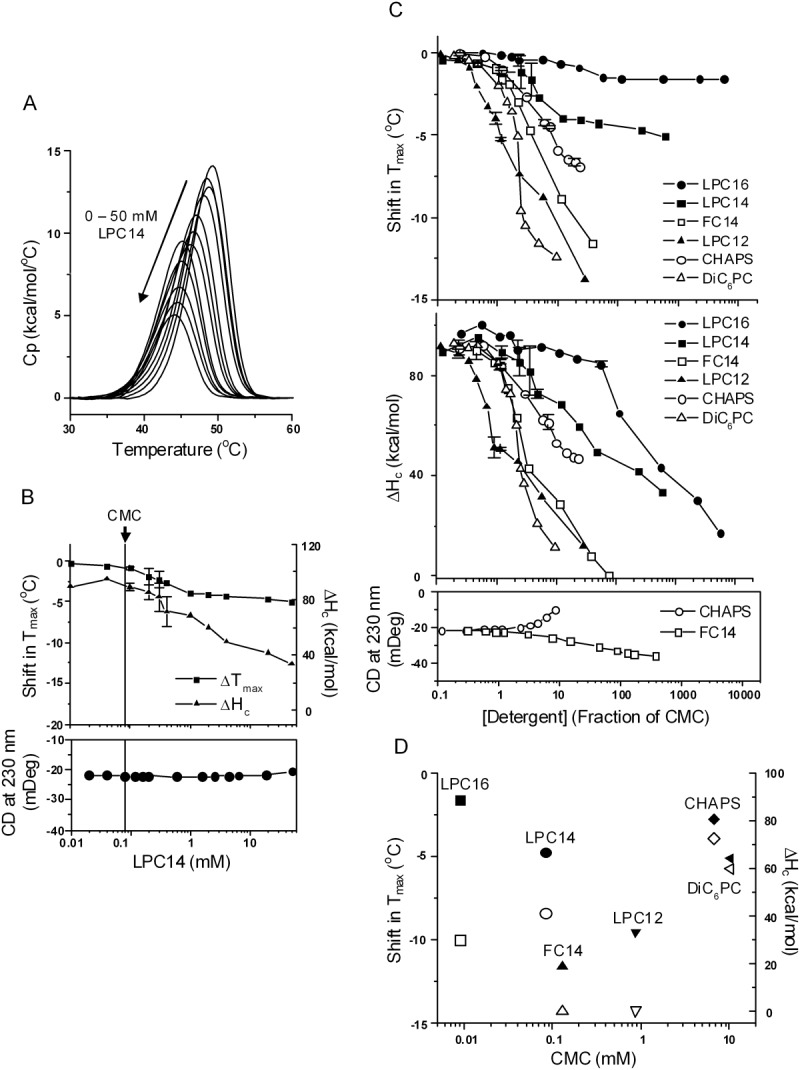
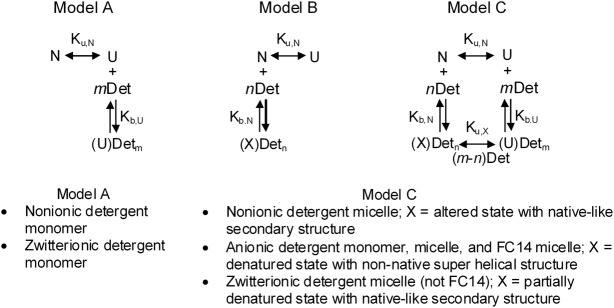
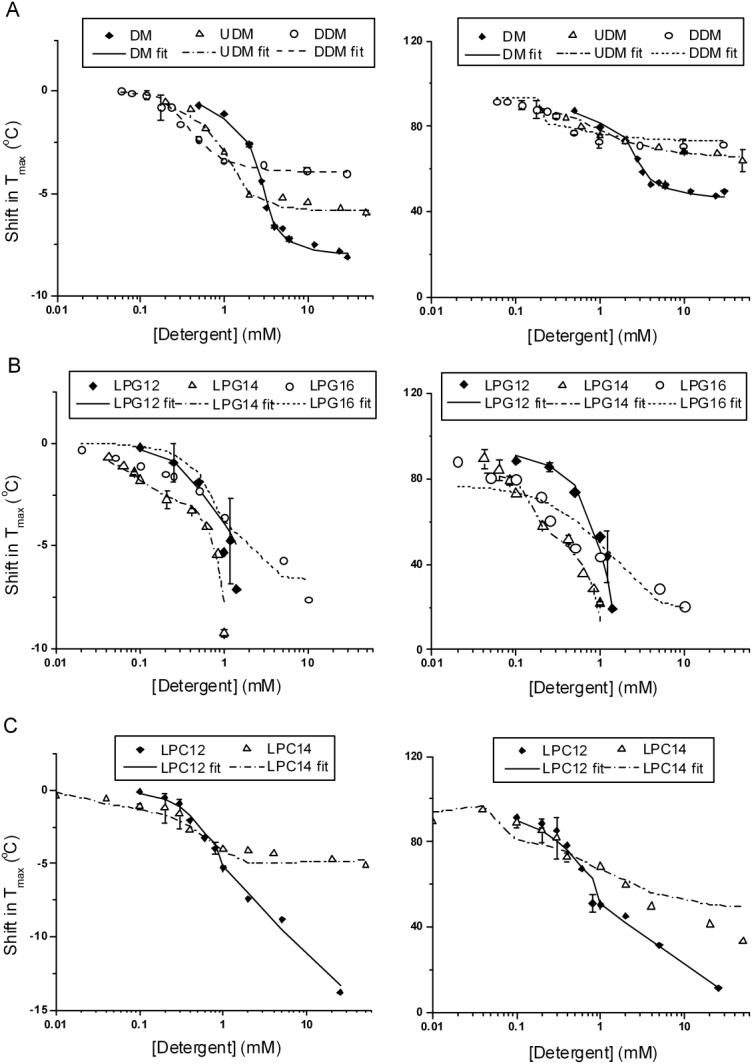
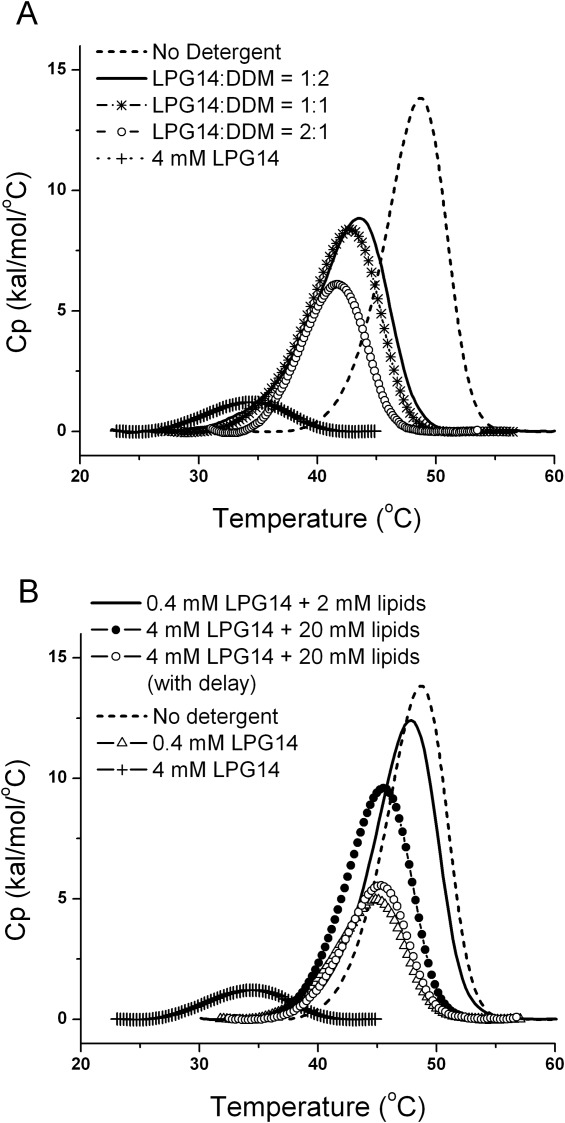
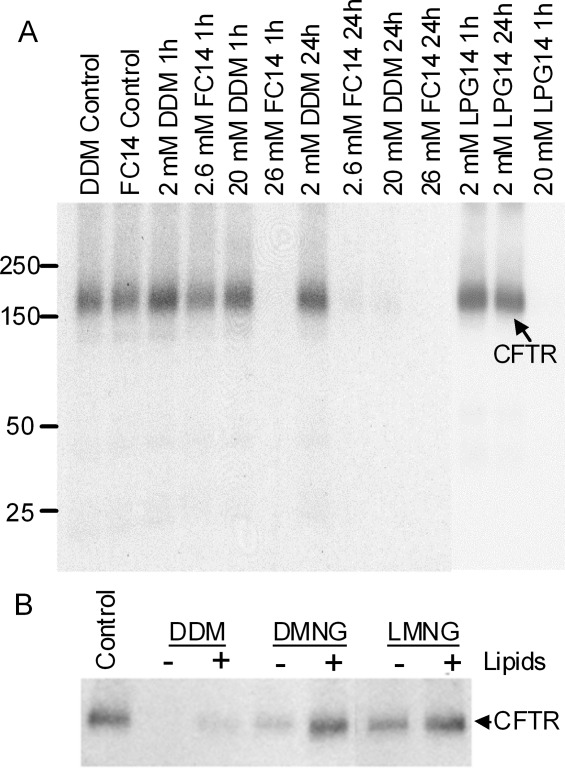
Detergent interaction with extramembranous soluble domains (ESDs) is not commonly considered an important determinant of integral membrane protein (IMP) behavior during purification and crystallization, even though ESDs contribute to the stability of many IMPs. Here we demonstrate that some generally nondenaturing detergents critically destabilize a model ESD, the first nucleotide-binding domain (NBD1) from the human cystic fibrosis transmembrane conductance regulator (CFTR), a model IMP. Notably, the detergents show equivalent trends in their influence on the stability of isolated NBD1 and full-length CFTR. We used differential scanning calorimetry (DSC) and circular dichroism (CD) spectroscopy to monitor changes in NBD1 stability and secondary structure, respectively, during titration with a series of detergents. Their effective harshness in these assays mirrors that widely accepted for their interaction with IMPs, i.e., anionic > zwitterionic > nonionic. It is noteworthy that including lipids or nonionic detergents is shown to mitigate detergent harshness, as will limiting contact time. We infer three thermodynamic mechanisms from the observed thermal destabilization by monomer or micelle: (i) binding to the unfolded state with no change in the native structure (all detergent classes); (ii) native state binding that alters thermodynamic properties and perhaps conformation (nonionic detergents); and (iii) detergent binding that directly leads to denaturation of the native state (anionic and zwitterionic). These results demonstrate that the accepted model for the harshness of detergents applies to their interaction with an ESD. It is concluded that destabilization of extramembranous soluble domains by specific detergents will influence the stability of some IMPs during purification.

Keywords: CD; CFTR; DSC; NBD1; detergent interaction; extramembrane domain; membrane protein; soluble domain; thermal unfolding.


Figures

Figure 1
Figure 1
The effect of nonionic detergents. A, DSC curves of NBD1 in the presence of DDM at increasing concentrations. Buffer conditions were 20 mM HEPES pH 7.5, 150 mM NaCl, 10% glycerol, 10% ethylene glycol, 1 mM TCEP, 20 µM ATP, 3 mM MgCl2. Same buffer conditions were used in all DSC and CD experiments. Data represent one set of experiments conducted on the same batch of protein on two separated dates within one week. B, Tmax shift (squares), ΔHc (triangles), and CD (solid circles) as function of DDM concentrations. The DSC data are average of two sets of experiments. The points with error bars represent the average of two or more experiments and the error bars are the standard deviations. The lines connecting the symbols are there to help guide the eye. The vertical line denotes the CMC of DDM. C, Tmax shift (upper panel) and ΔHc (middle panel) in the presence of all the nonionic detergents studied; lower panel, the change in CD signal induced by LMNG, C12E8, and OG. The majority of the data points represent one experiment. The points with error bars represent the average of two or more experiments and the error bars are the standard deviations. D, correlation between CMC and the magnitude of Tmax shift (solid symbols) and ΔHc (open symbols). Data were taken at 31 mM for OG, 10 mM for DMNG, LMNG and Façade-EM, and 20 mM for the rest of the detergents, all corresponding to approximately 1% w/v, a concentration commonly used for membrane protein extraction.
Figure 2
Figure 2
The effect of anionic detergents. A, DSC curves of NBD1 in the presence of LPG14 at increasing concentrations. Data represent one set of experiments conducted on the same day. B, Tmax shift (squares), ΔHc (triangles), and CD (solid circles) as function of LPG14 concentration. The vertical line denotes the CMC of LPG14. The majority of the DSC data represent the average of two sets of experiments. Standard deviation is shown as the error bar. C, Tmax shift (upper panel) and ΔHc (middle panel) in the presence of all the anionic detergents studied; lower panel, the change in CD signal induced by LPG12 and SDS. The lines connecting the symbols are there to help guide the eye. The majority of the data points represent one experiment. The points with error bars represent the average of two or more experiments and the error bars are the standard deviations. D, correlation between CMC and the magnitude of Tmax shift (solid symbols) and ΔHc (open symbols). Data were taken at detergent concentrations that correspond to half of their CMC except PFO. The Tm shift at 0.2× CMC of PFO is shown because it caused complete denaturation at 0.24× CMC.
Figure 3
Figure 3
The effect of zwitterionic detergents. A, DSC curves of NBD1 in the presence of LPC14 at increasing concentrations. Data represent one set of experiments conducted on three separate dates. B, Tmax shift (squares), ΔHc (triangles), and CD (solid circles) as function of LPC14 concentration. The vertical line denotes the CMC of LPC14. The DSC data are average of two sets of experiments. The points with error bars represent the average of two experiments and the error bars are the standard deviations. C, Tmax shift (upper panel) and ΔHc (middle panel) in the presence of all the zwitterionic detergents studied; lower panel, the change in CD signal induced by FC14 and CHAPS. The majority of the data points represent one experiment. The points with error bars represent the average of two or more experiments and the error bars are the standard deviations. The lines connecting the symbols are there to help guide the eye. D, correlation between CMC and the magnitude of Tmax shift (solid symbols) and ΔHc (open symbols). Data were taken at 20 mM detergent concentration except FC14. The Tm shift at 5 mM FC14 is shown because it caused complete denaturation at 10 mM.
Figure 4
Figure 4
Models for the global curve fitting of the DSC data. The detergent class fit by each model is listed under the model. The double headed arrow indicates an unfolding process that may occur in more than one discrete step. Species are N = native, folded; U = thermally unfolded; Definition of “X” depends on the detergent as shown in the box under Model B and Model C; note that the detergent induced denatured state and thermally unfolded state, U, are not necessarily the same energetic/structural states; Det = detergent; Det may represent monomer or micelle; n, m = number of detergent binding sites on N or U, respectively. See text for how the best-fit model was determined for each detergent class.
Figure 5
Figure 5
Comparison of experimental and fitted Tmax and ΔHc values for selected representatives from each detergent class. A, maltoside; B, LPGs; C, LPCs. Left panels are for shift in Tmax, and right panels are for ΔHc. The fitted Tmax and ΔHc values were extracted from the fitted DSC curves. The symbols represent the experimental values with error bars representing the standard deviations of two experiments, and the lines represent the fitted values; see Supporting Information for further discussion of the models and the actual experimental and fitted DSC curves (Supporting Information Fig. SF2). Global curve fitting was performed on all DSC curves collected for each detergent, except for DDM and LPG14, in which case one complete set of DSC curves collect on the same day or two separate dates within a week were used.
Figure 6
Figure 6
Increase in both Tmax and ΔHc due to the addition of DDM or phospholipids into the NBD1/LPG14 complex. A, the effect of added DDM. The total detergent concentrations were held constant at 10 mM, while the DDM/LPG14 ratio was increased. DSC curve in the presence of 4 mM LPG14 is shown as the control because LPG14 caused complete denaturation at 10 mM. B, the effect of added phospholipids. LPG14 and lipid concentrations are shown in the data labels. When lipids were added with delay, the delay time was 4 hrs. The composition of the lipids was POPC: POPE = 4:1 (w/w).
Figure 7
Figure 7
Photolabeling of full-length CFTR with 8-azido-[γ-32P]ATP. Membranes (10 µg protein) from BHK-21 cells expressing CFTR were incubated with 8-azido-[γ-32P]ATP (25 µM for 5 min), and then crosslinked by UV irradiation after exposure to different detergents for the indicated times (controls indicating 0 time). After crosslinking, CFTR was immunoprecipitated and subjected to SDS/PAGE and autoradiography. 32P radioactivity associated with the CFTR band was determined by electronic autoradiography (Packard Instant Imager). A, A comparison among DDM, FC14, and LPG14, in the absence of lipids. B, Membranes were incubated with 1% (w/v) of DDM, DMNG or LMNG for 2 hrs, followed by 0.2% (w/v) for 24 hrs, in the presence (+) or absence (−) of liver polar lipids (0.1% w/v final concentration). The control membranes in both panels were crosslinked immediately after solubilization.

Similar articles

Cited by

References

    1. Wiener MC. A pedestrian guide to membrane protein crystallization. Methods. 2004;34:364–372. - PubMed
    1. Seddon AM, Curnow P, Booth PJ. Membrane proteins, lipids and detergents: not just a soap opera. Biochim Biophys Acta. 2004;1666:105–117. - PubMed
    1. Garavito RM, Ferguson-Miller S. Detergents as tools in membrane biochemistry. J Biol Chem. 2001;276:32403–32406. - PubMed
    1. Prive GG. Detergents for the stabilization and crystallization of membrane proteins. Methods. 2007;41:388–397. - PubMed
    1. Linke D. Detergents: an overview. Methods Enzymol. 2009;463:63034–63042. - PubMed

Publication types

LinkOut - more resources