. 2014 Sep;25(9):1979-90.
doi: 10.1681/ASN.2013101143. Epub 2014 Mar 20.

Translational profiles of medullary myofibroblasts during kidney fibrosis

Affiliations

Translational profiles of medullary myofibroblasts during kidney fibrosis

Ivica Grgic et al. J Am Soc Nephrol. 2014 Sep.

Abstract

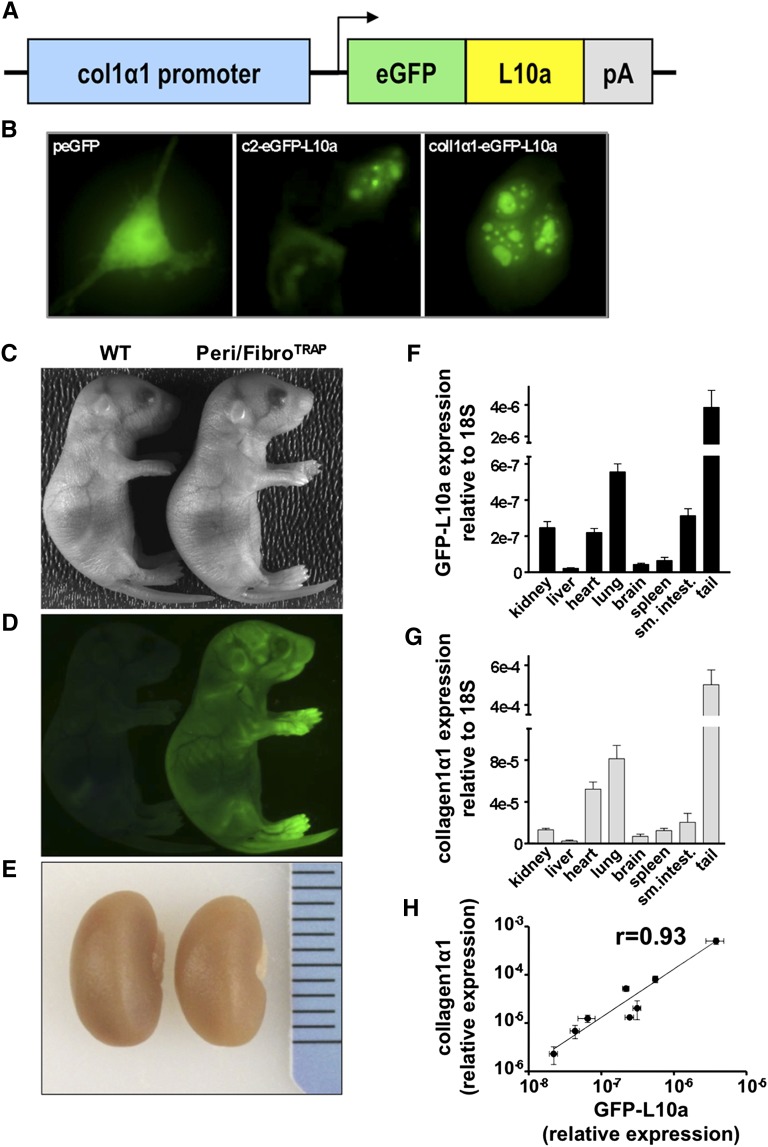
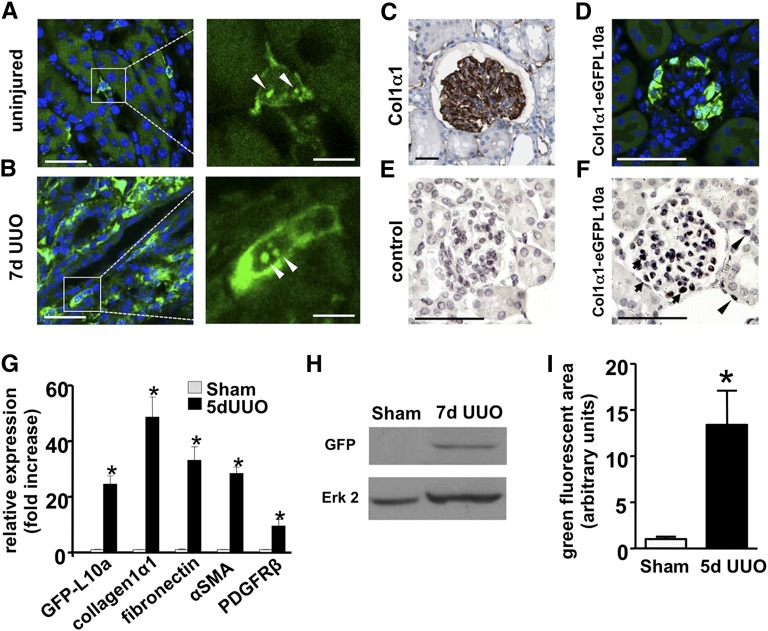
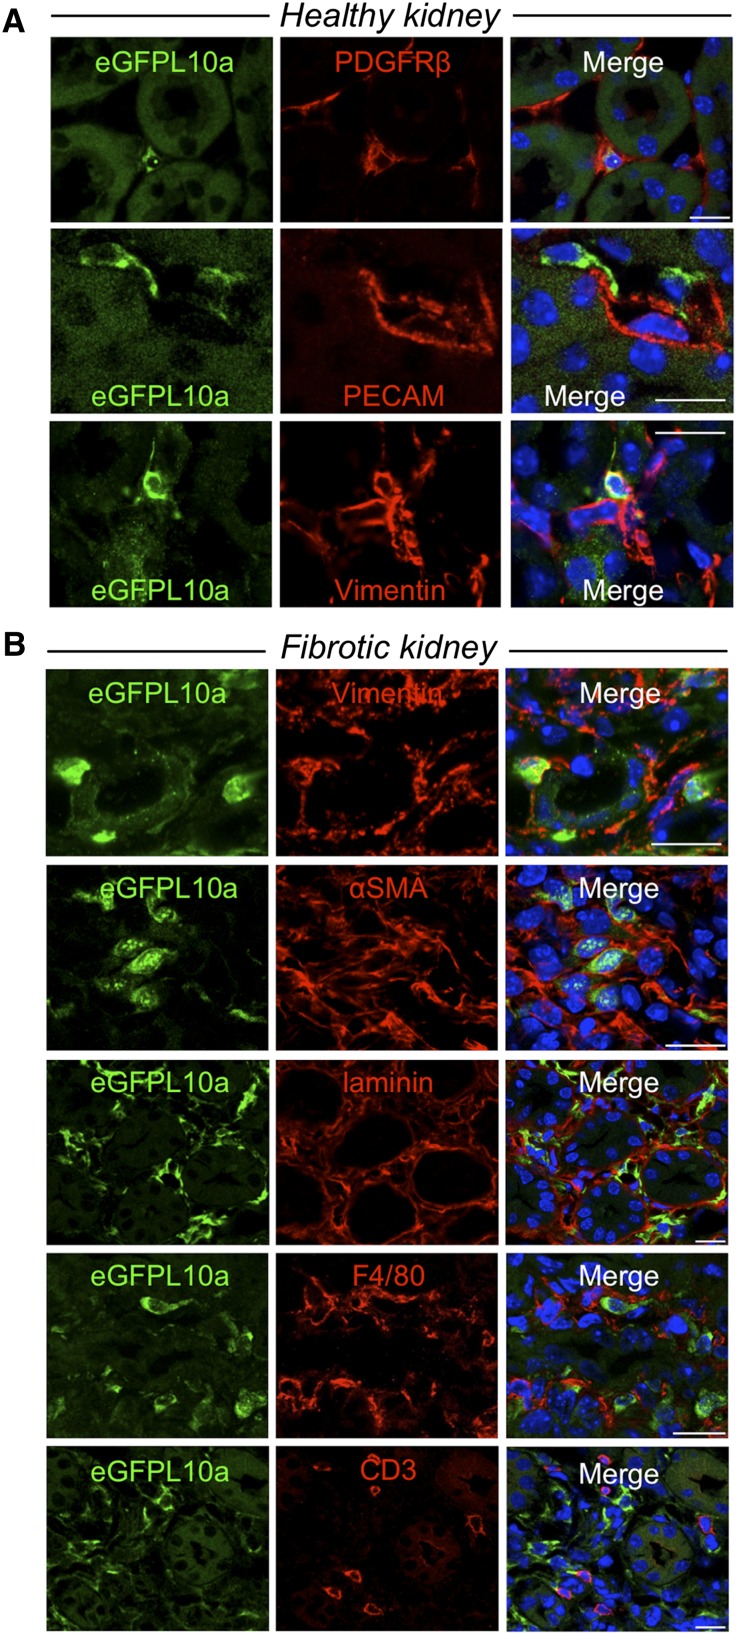
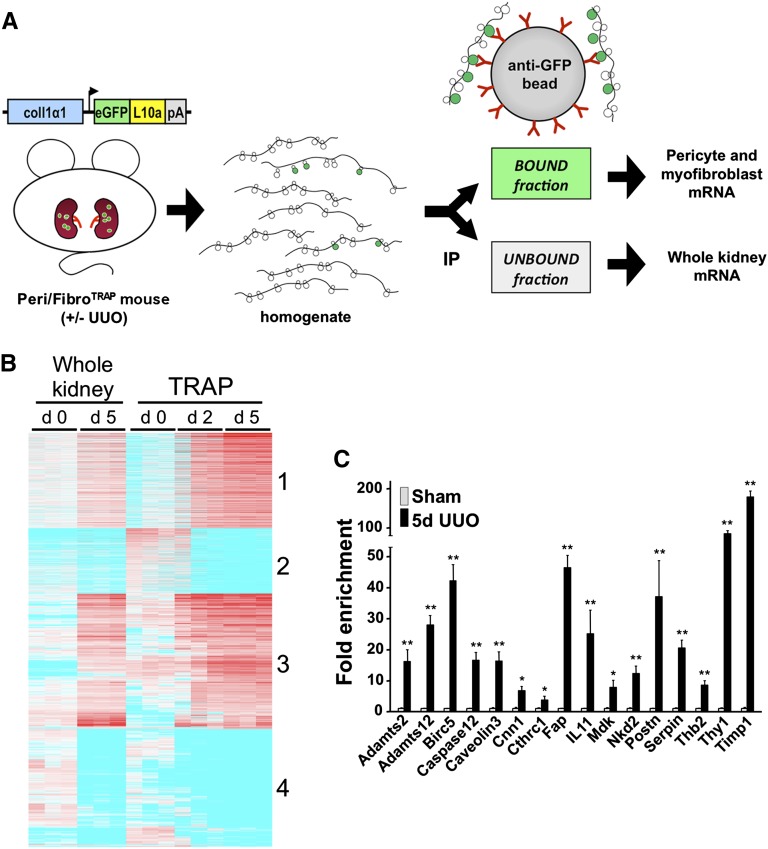
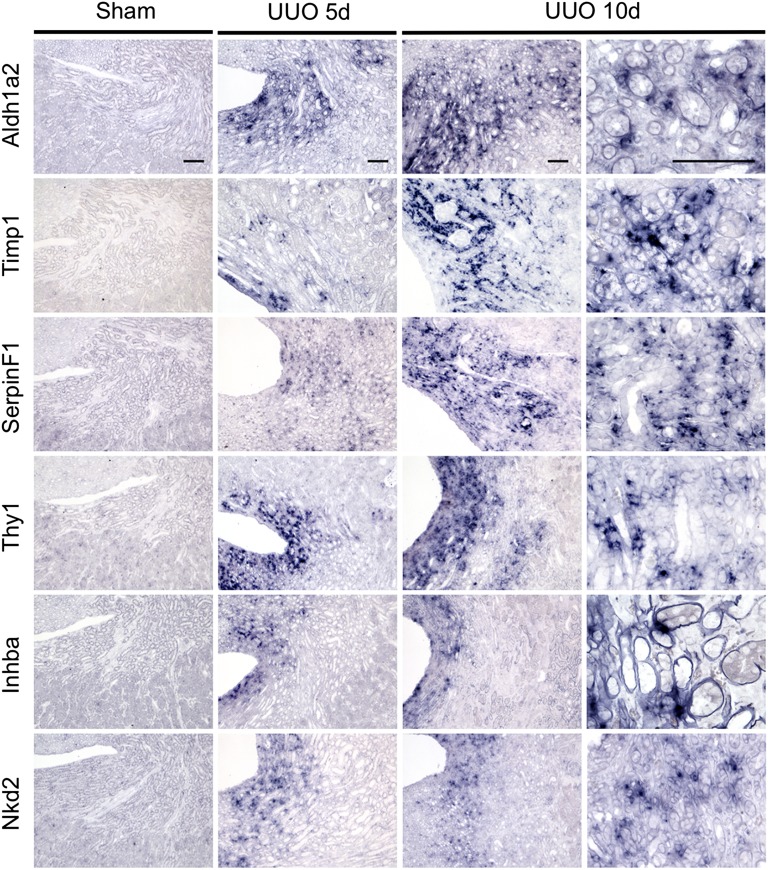
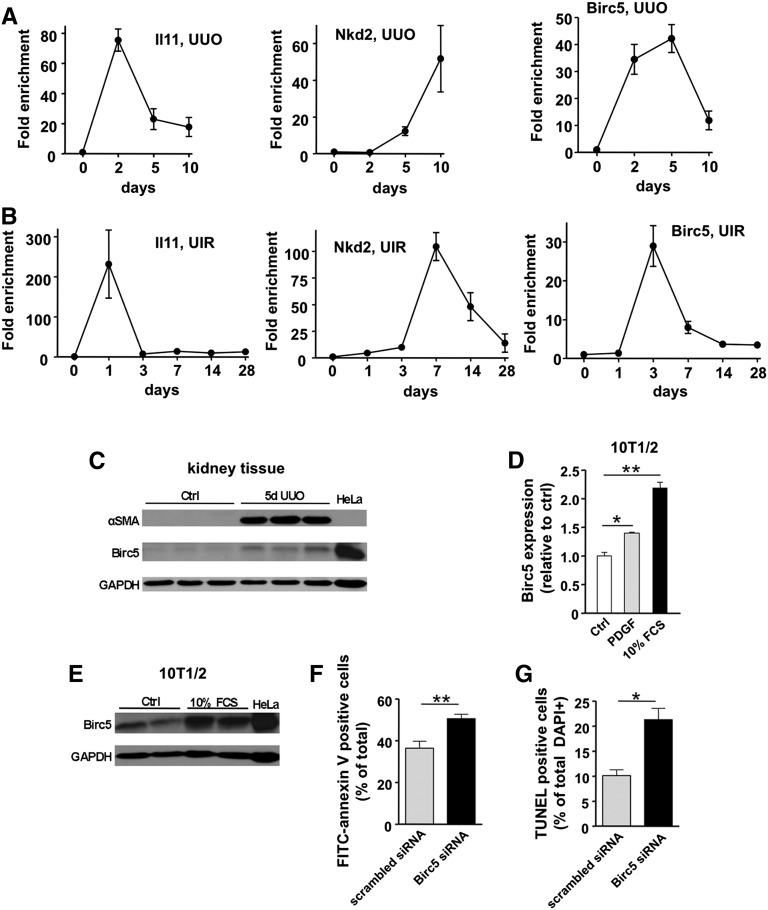
Myofibroblasts secrete matrix during chronic injury, and their ablation ameliorates fibrosis. Development of new biomarkers and therapies for CKD will be aided by a detailed analysis of myofibroblast gene expression during the early stages of fibrosis. However, dissociating myofibroblasts from fibrotic kidney is challenging. We therefore adapted translational ribosome affinity purification (TRAP) to isolate and profile mRNA from myofibroblasts and their precursors during kidney fibrosis. We generated and characterized a transgenic mouse expressing an enhanced green fluorescent protein (eGFP)-tagged L10a ribosomal subunit protein under control of the collagen1α1 promoter. We developed a one-step procedure for isolation of polysomal RNA from collagen1α1-eGFPL10a mice subject to unilateral ureteral obstruction and analyzed and validated the resulting transcriptional profiles. Pathway analysis revealed strong gene signatures for cell proliferation, migration, and shape change. Numerous novel genes and candidate biomarkers were upregulated during fibrosis, specifically in myofibroblasts, and we validated these results by quantitative PCR, in situ, and Western blot analysis. This study provides a comprehensive analysis of early myofibroblast gene expression during kidney fibrosis and introduces a new technique for cell-specific polysomal mRNA isolation in kidney injury models that is suited for RNA-sequencing technologies.


Figures

Figure 1.
Figure 1.
The Col1a1-eGFP-L10a transgenic mouse faithfully recapitulates endogenous COL1α1 expression. (A) Transgene structure. A cDNA encoding the eGFP-L10a fusion protein was inserted downstream of the col1α1 promoter/enhancer element. (B) 3T3 cells were transiently transfected with peGFP (control), c2-eGFP-L10a (positive control), or the col1α1-eGFP-L10a plasmid. C2-eGFP-L10a (middle) and col1α1-eGFP-L10a (right) transfected cells show the expected ribosomal localization pattern (nucleoli, perinuclear region). eGFP (left) transfected cells show a homogenously distributed fluorescence throughout the cell body. (C–E) Positive founders (right) exhibit prominent green fluorescence reflecting eGFP-L10a expression in skin fibroblasts. Gross kidney morphology is indistinguishable between mice. (F and G) qPCR comparison of eGFP-L10a and endogenous col1α1 expression in Peri/FibroTRAP animals. Expression levels of eGFP-L10a and endogenous col1α1 transcripts show similar patterns across various organs. Mean±SEM, n=4 for each data point. (H) Robust positive correlation between eGFP-L10a and native col1α1 expression. Data points reflect mean relative expression values±SEM of eGFP-L10a and col1α1 mRNA expression.
Figure 2.
Figure 2.
Enhanced eGFP-L10a expression during fibrosis in Peri/FibroTRAP mice. (A) Representative micrographs of uninjured kidney medulla. eGFP-L10a+ cells (green) are readily detected by epifluorescence and are found in the interstitium and not the tubular compartment. Note perinuclear and nucleolar (arrow heads) expression (right), a pattern consistent with ribosomal location. (B) Kidney medulla after 7 days of UUO. The population of eGFP-L10a+ cells shows vast expansion but remains confined to the tubulointerstitial space. Note accentuated perinuclear and nucleolar (arrow heads) fluorescence on higher magnification (right). Scale bars, left: 20 µm; right: 5 µm. (C) Immunohistochemical analysis of a normal, 16-year-old human kidney shows strong podocyte expression of col1α1, image from The Human Protein Atlas. (D) A similar podocyte eGFP-L10a expression pattern is observed in glomeruli from a normal adult Peri/FibroTRAP kidney. (E and F) By enhancing immunohistochemical analysis (antibody against GFP), glomerular expression and weak interstitial expression is also observed (arrow heads). (G) qPCR analysis shows a robust, approximately 25-fold induction of renal eGFP-L10a mRNA expression as well as other fibrotic readouts including col1α1, fibronectin, αSMA, and PDGFRβ during UUO. Data represent mean values±SEM, n=5–6 for each data point, *P<0.001. (H) Immunoblot showing induction of eGFP-L10a protein (about 50 kDa in size) in fibrotic kidney (7 days UUO). Expression is so low in uninjured medulla that protein is not detected at same exposure time. (I) Quantification of green fluorescent area in Peri/FibroTRAP kidney sections confirms a significant increase in signal at 5 days of UUO compared with uninjured controls. Data are shown as mean±SEM, n=3 for each data point; *P<0.05.
Figure 3.
Figure 3.
Immunostaining demonstrates cell type–specific expression of eGFP-L10a in Peri/FibroTRAP kidney. (A) In uninjured kidney, eGFP-L10a+ cells (green) of kidney medulla stain positive for pericyte/fibroblast markers PDGFR-β and vimentin and are closely associated with endothelial cell marker platelet endothelial cell adhesion molecule (PECAM)+peritubular capillaries, consistent with a pericyte/fibroblast identity. (B) In fibrotic kidney (5 days UUO), eGFP-L10a+ cells remain strictly confined to the tubulointerstitial compartment, as documented by antilaminin staining, continue to express vimentin but also express the myofibroblast marker αSMA, suggesting a pericyte/fibroblast to myofibroblast transformation. Although spatially close, eGFP-L10a+ cells do not costain with macrophage marker F4/80 or T-cell marker CD3. Scale bars: 10 µm.
Figure 4.
Figure 4.
Microarray analysis of TRAP-isolated RNA and candidate validation by qPCR in experimental fibrosis. (A) Schematic illustrating the principles and workflow of TRAP. Kidney medulla from Peri/FibroTRAP mice is harvested, immediately homogenized, and immunoprecipitated (IP) with anti-GFP–coated magnetic beads. Polysomes containing the tagged ribosomal protein eGFP-L10a bind to the beads, thus representing the pericyte-specific mRNA fraction; the unbound fraction represents the whole medulla. The mRNA is isolated and processed for downstream analysis. (B) Heat map of microarray results (Affymetrix Mouse Genome 430 2.0 chips) showing differential gene expression in bound, pericyte/myofibroblast-specific mRNA fractions extracted from sham, UUO day 2 and UUO day 5 kidneys from Peri/FibroTRAP mice. Unbound RNA, which reflects total kidney medulla, is also shown between sham and UUO day 5. Note clustering into 4 distinct groups. (C) Expression of 16 candidate genes identified as upregulated by TRAP was validated by qPCR of whole kidney RNA samples. Data are shown as mean±SEM, n=4 for each data point; *P<0.05; **P<0.01.
Figure 5.
Figure 5.
RNA in situ hybridization validates interstitial expression of novel myofibroblast genes during fibrosis. In situ hybridization comparing sham surgery versus UUO day 5 and day 10 for six novel myofibroblast genes strongly induced during fibrosis. All genes show an interstitial and not tubular expression pattern with strongest expression in medulla and extending to cortical interstitium. Scale bars: 100 µm.
Figure 6.
Figure 6.
Differential expression kinetics of genes identified by TRAP in two fibrosis models and functional validation of Birc5 as a potential target. (A) Time course analysis of IL11, Nkd2, and Birc5 (survivin) expression during UUO. (B) Expression of the same genes was analyzed in a second fibrotic model, unilateral ischemia-reperfusion (UIR). Note similar expression patterns. Mean±SEM, n=3–5 for each time point. (C) Analysis of renal Birc5 protein expression during UUO. Note concomitant induction of myofibroblast marker αSMA. HeLa cell lysate was used as positive control for Birc5. (D) In vitro stimulation of pericyte-like 10T1/2 cells with PDGF (20 ng/ml) or FCS (10%) for 24 hours causes a significant increase in Birc5 expression. Mean±SEM, n=3 for each data point; *P<0.01; **P<0.001. (E) Birc5 protein is also increased in 10T1/2 cells upon stimulation with 10% FCS compared to unstimulated control (Ctrl). (F) Analysis of cell apoptosis by FITC-annexin V staining of 10T1/2 cells. Knockdown of Birc5 by siRNA results in significant increase of apoptotic rate compared with scrambled siRNA-transfected control cells. Serum starvation was used to induce apoptosis. Mean±SEM, n=13–17 for each data point. (G) Analysis of TUNEL labeling confirms enhanced cell apoptosis upon siRNA mediated knockdown of Birc5. Mean±SEM, n=3–4; *P<0.01; **P<0.001. GAPDH, glyceraldehyde 3-phosphate dehydrogenase.

References

    1. Huntley RP, Binns D, Dimmer E, Barrell D, O’Donovan C, Apweiler R: QuickGO: A user tutorial for the web-based Gene Ontology browser. Database (Oxford) 2009: bap010, 2009 - PMC - PubMed
    1. Subramanian A, Tamayo P, Mootha VK, Mukherjee S, Ebert BL, Gillette MA, Paulovich A, Pomeroy SL, Golub TR, Lander ES, Mesirov JP: Gene set enrichment analysis: A knowledge-based approach for interpreting genome-wide expression profiles. Proc Natl Acad Sci U S A 102: 15545–15550, 2005 - PMC - PubMed
    1. Gong Y, Ma Z, Patel V, Fischer E, Hiesberger T, Pontoglio M, Igarashi P: HNF-1beta regulates transcription of the PKD modifier gene Kif12. J Am Soc Nephrol 20: 41–47, 2009 - PMC - PubMed
    1. Schieren G, Rumberger B, Klein M, Kreutz C, Wilpert J, Geyer M, Faller D, Timmer J, Quack I, Rump LC, Walz G, Donauer J: Gene profiling of polycystic kidneys. Nephrol Dial Transplant 21: 1816–1824, 2006 - PubMed
    1. Yuen PS, Jo SK, Holly MK, Hu X, Star RA: Ischemic and nephrotoxic acute renal failure are distinguished by their broad transcriptomic responses. Physiol Genomics 25: 375–386, 2006 - PMC - PubMed

Publication types

MeSH terms