. 2014 Mar;196(3):745-65.
doi: 10.1534/genetics.113.158568.

A novel CaM kinase II pathway controls the location of neuropeptide release from Caenorhabditis elegans motor neurons

Affiliations

A novel CaM kinase II pathway controls the location of neuropeptide release from Caenorhabditis elegans motor neurons

Christopher M Hoover et al. Genetics. 2014 Mar.

Abstract

Neurons release neuropeptides via the regulated exocytosis of dense core vesicles (DCVs) to evoke or modulate behaviors. We found that Caenorhabditis elegans motor neurons send most of their DCVs to axons, leaving very few in the cell somas. How neurons maintain this skewed distribution and the extent to which it can be altered to control DCV numbers in axons or to drive release from somas for different behavioral impacts is unknown. Using a forward genetic screen, we identified loss-of-function mutations in UNC-43 (CaM kinase II) that reduce axonal DCV levels by ∼90% and cell soma/dendrite DCV levels by ∼80%, leaving small synaptic vesicles largely unaffected. Blocking regulated secretion in unc-43 mutants restored near wild-type axonal levels of DCVs. Time-lapse video microscopy showed no role for CaM kinase II in the transport of DCVs from cell somas to axons. In vivo secretion assays revealed that much of the missing neuropeptide in unc-43 mutants is secreted via a regulated secretory pathway requiring UNC-31 (CAPS) and UNC-18 (nSec1). DCV cargo levels in unc-43 mutants are similarly low in cell somas and the axon initial segment, indicating that the secretion occurs prior to axonal transport. Genetic pathway analysis suggests that abnormal neuropeptide function contributes to the sluggish basal locomotion rate of unc-43 mutants. These results reveal a novel pathway controlling the location of DCV exocytosis and describe a major new function for CaM kinase II.

Keywords: C. elegans; CaM Kinase II; Dense core vesicle; Neuropeptide release; Regulated secretion; placeholder.


Figures
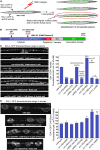
Figure 1
Figure 1
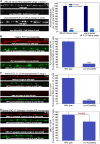
unc-43 mutant motor neuron axons are missing most of a DCV transmembrane cargo due to loss of UNC-43 function in the same neurons. (A) Schematic illustrating the forward genetic screen by which this study identified unc-43 mutants. We screened F2 grandprogeny of the mutagenized animals on 96-well glass-bottom Mat-Tek plates using an inverted microscope and selected animals with brighter cell somas and/or fainter dorsal axons. The cholinergic motor neuron cell somas are found only on the ventral side of the animal’s body. Narrow axonal commissures (not shown) connect many of the cell somas to the main axon tracts on the dorsal side of the animal. EMS, ethylmethanesulfonate. (B) Scale drawing depicting the UNC-43G isoform with mutation locations and percentage identities to its human ortholog CaM kinase II δ (accession no. NP_742113). Domain boundaries are from Wang (2008) (catalytic and regulatory domains) and from Rosenberg et al. (2006) (association domain). Percentage identity of the variable domain does not include a 39-aa insertion that is present in the UNC-43G splice isoform. (C) Representative, identically scaled images and quantification of IDA-1-GFP transmembrane cargo, expressed from the integrated transgene ceIs76, in cholinergic motor neuron axons in animals with the indicated genotypes. ceEx388 and ceEx389 are stable extrachromosomal transgenes that express the unc-43g (+) and unc-43g (K41R; kinase dead) cDNAs, respectively, from the same promoter used in the ceIs76 transgene. Graph data are means and standard errors of the background-adjusted total dorsal cord fluorescence per μm of cord length from 13 animals each. ***P ≤ 0.001 by Tukey’s Test when comparing the indicated genotypes to wild type or to each other; n.s., P > 0.05 (not significant). (D) Representative, identically scaled images and quantification of IDA-GFP transmembrane cargo expressed from the integrated transgene ceIs76 in ventral cord motor neuron somas in animals with the indicated genotypes. Dashed lines outline the cell soma boundaries. Graph data are means and standard errors of the background-adjusted total cell soma fluorescence per μm2 from 12 animals each. **P < 0.05 and *P = 0.01 by Dunnett’s test, when comparing the indicated genotypes to wild type. Bars without asterisks are not significantly different from wild type (P > 0.05).
Figure 2
Figure 2
Strongly decreased levels of a DCV soluble cargo in unc-43 mutant axons and cell somas. (A) Schematic illustrating the subset of DA/DB motors neurons in which the unc-129 promoter drives expression. This promoter was used in most transgenes in this study. Boxed regions indicate regions selected for imaging. The spacing between the DA6 and DB6 cell somas is variable and contains the dendrites from each cell. (B and C) Representative, identically scaled images and quantification of Venus cargo, expressed from the integrated transgene ceIs56 in DA/DB motor neuron axons (B) and DA6/DB6 cell somas (C) in animals with the indicated genotypes. Dashed lines outline the cell soma boundaries in C. The fluorescent signal represents soluble intravesicular Venus that has been cleaved from the NLP-21-Venus pro-neuropeptide by EGL-3 (PC2 convertase) (Figure S1) (Edwards et al. 2009). Graph data are means and standard errors of the background-adjusted total dorsal cord fluorescence per μm of cord length (B) or background-adjusted cell soma fluorescence per μm2 from 13 (B) or 12 (C) animals each. ***P ≤ 0.001 by Tukey’s test when comparing the indicated genotypes to wild type. n.s., not significant (P > 0.05).
Figure 3
Figure 3
unc-43 mutant axons are missing ∼90% of their neuropeptide and processing enzyme DCV cargos, but a synaptic vesicle cargo is only mildly affected. (A) Representative, identically scaled images and quantification of INS-22-Venus cargo expressed from the integrated transgene nuIs195 (first pair of bars) or unprocessed NLP-21-Venus cargo expressed from the ceIs56 transgene in an egl-3 null mutant background (second pair of bars) in DA/DB motor neuron axons in animals with the indicated genotypes. The fluorescent signals in this experiment represent aggregated neuropeptide cargos (Figure S1) (Edwards et al. 2009). Graph data are means and standard errors of the total background-adjusted dorsal cord fluorescence per μm of cord length from 13 animals each. ***P ≤ 0.001 by the unpaired t-test with Welch correction when comparing the indicated genotypes to wild type. (B–D) Representative images and quantification from immunostaining of native FLP neuropeptides (B; red signal), native EGL-21 (C; red signal) and native UNC-17 (D; red signal) in the dorsal cord axons of animals with the indicated genotypes. In B, we costained with an antibody that recognizes UNC-47 (the SV GABA transporter; bottom green image in each pair in B) as a permeabilization control and then plotted the ratio of the two signals. In C and D, we immunostained in a ceIs123 genetic background, which expresses soluble GFP in the dorsal cord axons. We co-immuostained the strains in C and D with an anti-GFP antibody as a permeabilization control (bottom green image in each pair in C and D). We visualized the anti-GFP antibody using a far-red Dylight 650 secondary antibody and then plotted the ratio of the two signals. Graphs show means and standard errors of the ratios of the red/green signals from 18 animals each. ***P ≤ 0.001 by the unpaired t-test with Welch correction when comparing the indicated genotypes to wild type.
Figure 4
Figure 4
Electron microscopy analysis: unc-43 mutant axons are missing up to 90% of their dense core vesicles, but synaptic vesicles are only mildly affected. (A) Representative electron micrographs of ACh motor neuron synaptic profiles from the dorsal nerve cord axons of wild type and the unc-43(ce725) nonsense mutant as indicated. PD, presynaptic density; SV, synaptic vesicle; DCV, dense core vesicle. (B and C) Quantification of the number of DCVs (B) or SVs (C) per synaptic profile in animals with the indicated genotypes. Data are means and standard errors from 57 wild type, 77 unc-43(ce725), or 66 unc-43(ce685) synaptic profiles from 8, 14, or 12 ACh synapses, respectively, collected from a total of two animals for each genotype. **P ≤ 0.01 by Dunnett’s test when comparing the indicated genotypes to wild type. n.s., not significant (P > 0.05).
Figure 5
Figure 5
UNC-68 (ryanodine receptor) contributes to UNC-43-mediated DCV cargo trafficking. (A) Representative, identically scaled images of axonal INS-22-Venus neuropeptide cargo expressed from the nuIs195 integrated transgene in animals with the indicated genotypes. (B) Quantification of axonal fluorescence from soluble DCV cargo from NLP-21-Venus expressed from the ceIs56 transgene (first set of bars), or aggregated neuropeptide cargo from INS-22-Venus expressed from the nuIs195 transgene (second set of bars). The last two bars in each set are two different unc-68 mutants. The data are means and standard errors of the total background-adjusted dorsal cord fluorescence per μm of cord length from 13 animals. **P ≤ 0.01 by Dunnett’s test when comparing the indicated genotypes to wild type. Bars lacking asterisks are not significantly different from wild type (P > 0.05). (C) Quantification of axonal fluorescence from aggregated neuropeptide cargo from INS-22-Venus expressed from the nuIs195 transgene in unc-68 and unc-43 single and double mutants, showing that impairing UNC-68 does not further worsen the unc-43 INS-22-Venus trafficking phenotype. The data are means and standard errors of the total background-adjusted dorsal cord fluorescence per μm of cord length from 13 animals. ***P < 0.001 by Tukey’s test when comparing the indicated genotypes to wild type. n.s., not significant (P > 0.05).
Figure 6
Figure 6
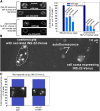
DCV neuropeptide cargos largely fail to enter axons in unc-43 mutants. (A) Images of the DA6 motor neuron soma (outlined in dashes) with its axonal commissure exiting the cell soma on the ventral side of the animal (left) and the same commissure entering the nerve cord on the dorsal side of the animal (right). The fluorescent signal comes from NLP-21-Venus neuropeptide in dense core vesicles expressed from the integrated transgene ceIs56. Time-lapse imaging demonstrates that most of these puncta represent individual vesicles (Goodwin et al. 2012). (B and C) Representative, identically scaled images and quantification of soluble NLP-21-Venus cargo, expressed from the integrated transgene ceIs56 (first pair of bars), or unprocessed NLP-21-Venus cargo (aggregated neuropeptide cargo; Figure S1) (Edwards et al. 2009), expressed from the ceIs56 transgene in an egl-3 null mutant background (second pair of bars) in DA/DB motor neuron axons in animals with the indicated genotypes. Graph for (B) are the data means and standard errors from the following numbers of puncta: 391 (wild type; from 24 commissures), 138 (unc-43 mutant; from 23 commissures), 358 (egl-3 mutant; from 26 commissures), or 36 (unc-43; egl-3 double mutant; 19 commissures). Graph data for (C) are means and standard errors from the following numbers of puncta: 153 (wild type; from 13 commissures), 39 (unc-43 mutant; from 14 commissures), 112 (egl-3 mutant; from 13 commissures), or 19 (unc-43; egl-3 double mutant; from 12 commissures). ***P ≤ 0.001 by the unpaired t-test with Welch correction when comparing the indicated genotypes to wild type (or to the egl-3 null mutant for the aggregated cargo experiments).
Figure 7
Figure 7
unc-43 mutants lose neuropeptide cargoes via secretion. (A) Representative, identically scaled images and quantification of INS-22-Venus cargo, expressed from the integrated transgene nuIs195 (first pair of bars), or unprocessed NLP-21-Venus cargo, expressed from the ceIs56 transgene in an egl-3 null mutant background (second pair of bars), in DA6/DB6 cell somas and dendrites in animals with the indicated genotypes. The fluorescent signals in this experiment represent aggregated neuropeptide cargos. Graph data are means and standard errors from 12 animals each. ***P ≤ 0.001, **P ≤ 0.0012, and *P ≤ 0.02 by the unpaired t-test with Welch correction when comparing the indicated genotypes to wild type (or the egl-3 mutant for the unprocessed NLP-21-Venus cargo data). Error bars for control strains are for soma + dendrite combined data. (B) Representative image of a coelomocyte containing secreted INS-22-Venus. The bright patches in the coelomocyte are endosomes that have endocytosed the secreted neuropeptide from the animal’s pseudocoelom. All of the INS-22-Venus comes from expression of the integrated transgene nuIs195 in a set of nine motor neuron cell somas, one of which is indicated. Also indicated are autofluorescent patches from intestinal granules. (C) Graph and representative, identically scaled images of secreted INS-22-Venus levels in coelomocytes of wild-type and unc-43 loss-of-function mutants. Graph data are means and standard errors of the background-adjusted total coelomocyte fluorescence from 27 wild-type and 32 unc-43 mutant animals.
Figure 8
Figure 8
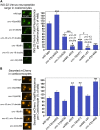
The loss of neuropeptide from unc-43 mutant neurons requires regulated secretion machinery. (A) Representative, identically scaled images and quantification of coelomocytes containing secreted INS-22-Venus. The bright patches in the coelomocyte are endosomes that have endocytosed the secreted neuropeptide from the animal’s pseudocoelom. All of the INS-22-Venus comes from expression of the integrated transgene ceIs201 in cholinergic motor neurons. Graph data are means and standard errors of the background-adjusted total coelomocyte fluorescence from 28 to 32 coelomocytes (from 28 to 32 different animals). ***P < 0.001 and *P < 0.05 by Tukey’s test when comparing the indicated genotypes to wild type or to each other, as indicated. (B) Representative, identically scaled images and quantification of coelomocytes containing constitutively secreted mCherry. These are the same coelomocytes shown in A because the ceIs201 transgene also co-expresses mCherry with a signal sequence as an internal control for constitutive secretion and coelomocyte function. Graph data are means and standard errors of the background-adjusted total coelomocyte fluorescence from 28 to 32 coelomocytes (from 28–32 different animals). **P < 0.01 by Dunnett’s test when comparing the indicated genotypes to wild type.
Figure 9
Figure 9
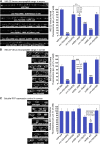
Blocking regulated secretion machinery allows neuropeptide cargoes to accumulate in unc-43 mutant axons. (A and B) Representative, identically scaled images and quantification of INS-22-Venus cargo in dorsal axons (A) and cell somas (B) in animals with the indicated genotypes. INS-22-Venus is expressed from the integrated transgene ceIs201 in cholinergic motor neurons. The fluorescent signals represent aggregated neuropeptide cargos. Dashed lines outline the cell soma boundaries in B as determined by tracing the cell soma soluble mCherry signal from the identical cells in C. Graph data are means and standard errors from 12 to 13 animals each. ***P < 0.001 and *P <0.05 by Tukey’s test when comparing the indicated genotypes to wild type or each other as indicated. n.s., not significant (P ≥ 0.05). (C) Representative, identically scaled images and quantification of mCherry in cell somas as a control for transgene expression in animals with the indicated genotypes. mCherry is co-expressed with INS-22-Venus from the integrated transgene ceIs201, and the representative images are of the same cell somas shown in B. Dashed lines outline the cell somas. **P ≤ 0.01 by Dunnett’s test when comparing to wild type.
Figure 10
Figure 10
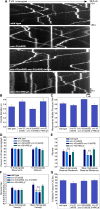
CaM kinase II is not required for active transport of DCVs between cell somas and the synaptic region of axons. (A) Representative kymographs of DCV movements in motor neuron commissures of the indicated genotypes. The left part of each image is closest to the cell soma, while the right part extends to near the start of the synaptic region in the dorsal axon. Each movie represents 20 sec of DCV movements. Anterograde movements angle toward the lower right, while retrograde movements angle toward the lower left. Stationary puncta are vertical lines. (B–G) Graphs plotting various parameters extracted from the kymographs as indicated. For all graphs, the indicated parameter was calculated as an average or a percentage based on all movements in each kymograph, and then the average of all of the kymographs was plotted (n = 23, 22, 25, and 20 wild type, unc-31, unc-43 unc-31 double mutant, and unc-43 gf, respectively). Error bars represent standard errors. **P ≤ 0.01 by Dunnett’s test when comparing to wild type. Bars without asterisks are not significantly different from wild type when compared by Dunnett’s test. n.s., not significant when non-wild-type strains are compared using Tukey’s test.
Figure 11
Figure 11
DCV densities in wild-type cell somas are ∼2% of DCV densities at synapses. (A and B) Three-dimensional reconstructions of motor neuron cell somas (A) and axonal synapses (B) from electron micrographs of serial thin sections cut from high-pressure-frozen wild-type animals. Light blue spheres, synaptic vesicles; black spheres, dense core vesicles; red, active zone dense projection; green, mitochondria; brown, nucleus; blue, Golgi and Golgi-adjacent vesicles; dark gray, endoplasmic reticulum; light gray, multivesicular bodies.
Figure 12
Figure 12
Abnormal neuropeptide function contributes to the sluggish basal locomotion of unc-43 lf mutants. The graph compares the basal (unstimulated) locomotion rates of wild type with the indicated mutants. All alleles are null deletion or early nonsense loss-of-function mutants. Error bars are SEMs of 10 animals each. P-values are from the unpaired t-test with Welch correction.

Comment in

Similar articles

Cited by

References

    1. Arvan P., Castle D., 1998. Sorting and storage during secretory granule biogenesis: looking backward and looking forward. Biochem. J. 332(Pt 3): 593–610. - PMC - PubMed
    1. Bauer Huang S. L., Saheki Y., VanHoven M. K., Torayama I., Ishihara T., et al. , 2007. Left-right olfactory asymmetry results from antagonistic functions of voltage-activated calcium channels and the Raw repeat protein OLRN-1 in C. elegans. Neural Dev. 2: 24. - PMC - PubMed
    1. Baylis H. A., Furuichi T., Yoshikawa F., Mikoshiba K., Sattelle D. B., 1999. Inositol 1,4,5-trisphosphate receptors are strongly expressed in the nervous system, pharynx, intestine, gonad and excretory cell of Caenorhabditis elegans and are encoded by a single gene (itr-1). J. Mol. Biol. 294: 467–476. - PubMed
    1. Borgonovo B., Ouwendijk J., Solimena M., 2006. Biogenesis of secretory granules. Curr. Opin. Cell Biol. 18: 365–370. - PubMed
    1. Brenner S., 1974. The genetics of C. elegans. Genetics 77: 71–94. - PMC - PubMed

Publication types

MeSH terms