

Extreme HOT regions are CpG-dense promoters in C. elegans and humans
- PMID: 24653213
- PMCID: PMC4079969
- DOI: 10.1101/gr.161992.113
Extreme HOT regions are CpG-dense promoters in C. elegans and humans
Abstract
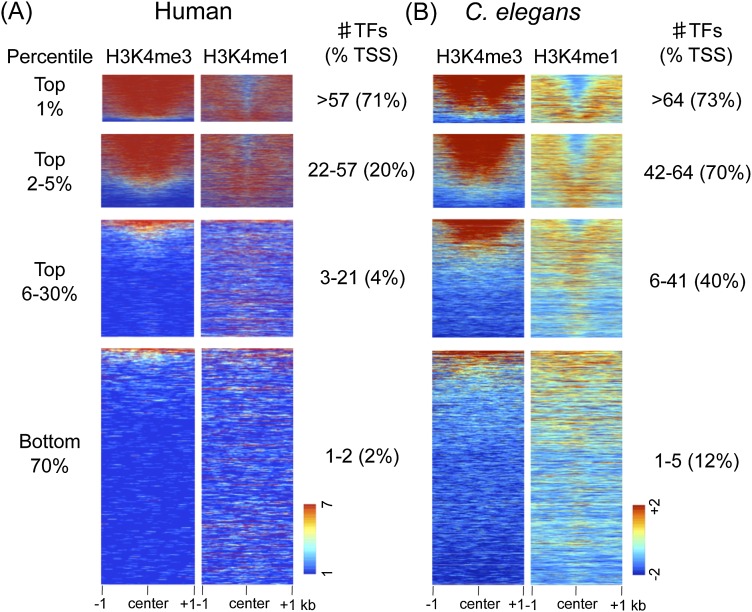
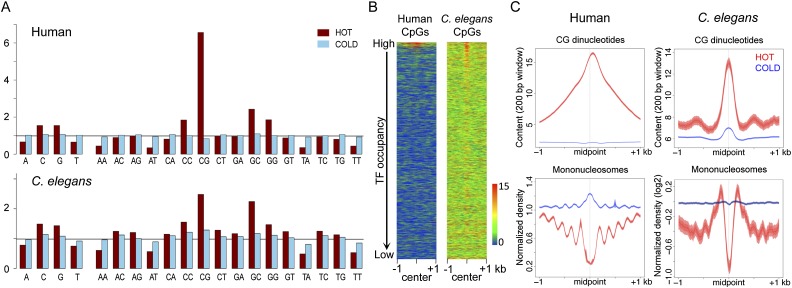
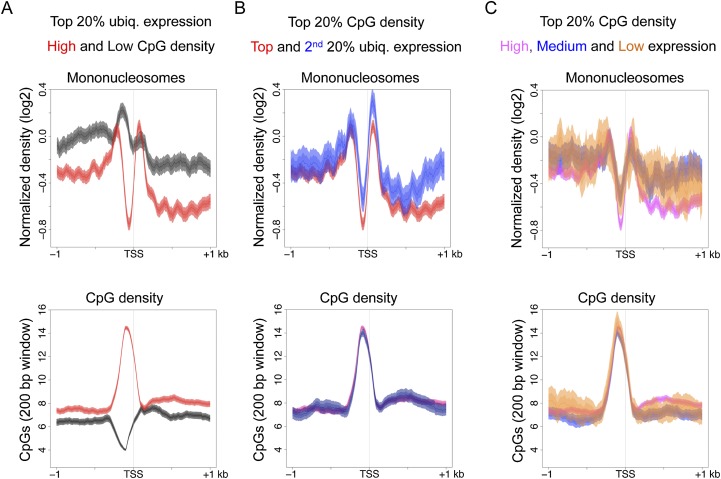
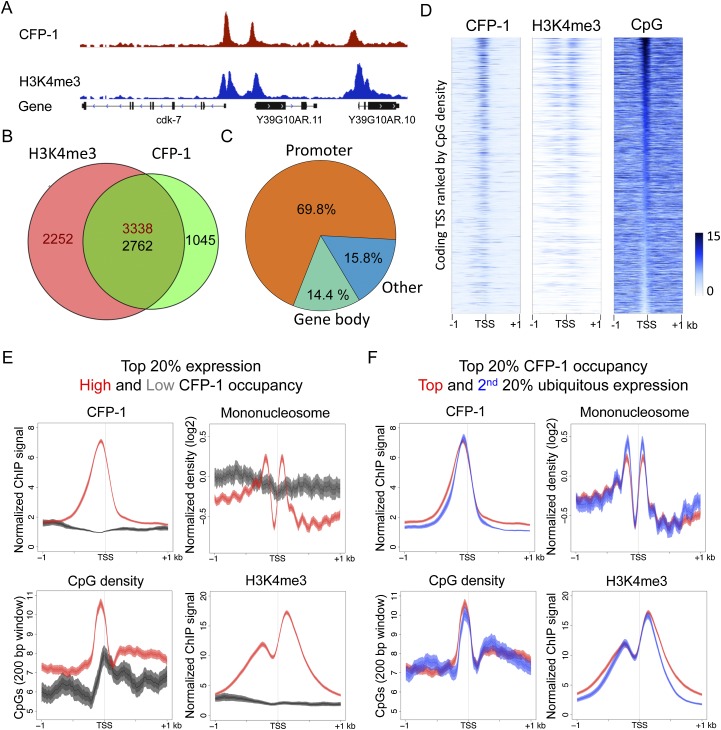
Most vertebrate promoters lie in unmethylated CpG-dense islands, whereas methylation of the more sparsely distributed CpGs in the remainder of the genome is thought to contribute to transcriptional repression. Nonmethylated CG dinucleotides are recognized by CXXC finger protein 1 (CXXC1, also known as CFP1), which recruits SETD1A (also known as Set1) methyltransferase for trimethylation of histone H3 lysine 4, an active promoter mark. Genomic regions enriched for CpGs are thought to be either absent or irrelevant in invertebrates that lack DNA methylation, such as C. elegans; however, a CXXC1 ortholog (CFP-1) is present. Here we demonstrate that C. elegans CFP-1 targets promoters with high CpG density, and these promoters are marked by high levels of H3K4me3. Furthermore, as for mammalian promoters, high CpG content is associated with nucleosome depletion irrespective of transcriptional activity. We further show that highly occupied target (HOT) regions identified by the binding of a large number of transcription factors are CpG-rich promoters in C. elegans and human genomes, suggesting that the unusually high factor association at HOT regions may be a consequence of CpG-linked chromatin accessibility. Our results indicate that nonmethylated CpG-dense sequence is a conserved genomic signal that promotes an open chromatin state, targeting by a CXXC1 ortholog, and H3K4me3 modification in both C. elegans and human genomes.
© 2014 Chen et al.; Published by Cold Spring Harbor Laboratory Press.
Figures
Similar articles
-
CpG islands influence chromatin structure via the CpG-binding protein Cfp1.Nature. 2010 Apr 15;464(7291):1082-6. doi: 10.1038/nature08924. Nature. 2010. PMID: 20393567 Free PMC article.
-
Cfp1 integrates both CpG content and gene activity for accurate H3K4me3 deposition in embryonic stem cells.Genes Dev. 2012 Aug 1;26(15):1714-28. doi: 10.1101/gad.194209.112. Genes Dev. 2012. PMID: 22855832 Free PMC article.
-
Links between DNA methylation and nucleosome occupancy in the human genome.Epigenetics Chromatin. 2017 Apr 11;10:18. doi: 10.1186/s13072-017-0125-5. eCollection 2017. Epigenetics Chromatin. 2017. PMID: 28413449 Free PMC article.
-
Understanding the interplay between CpG island-associated gene promoters and H3K4 methylation.Biochim Biophys Acta Gene Regul Mech. 2020 Aug;1863(8):194567. doi: 10.1016/j.bbagrm.2020.194567. Epub 2020 Apr 29. Biochim Biophys Acta Gene Regul Mech. 2020. PMID: 32360393 Free PMC article. Review.
-
Histone H3K4 trimethylation: dynamic interplay with pre-mRNA splicing.Biochem Cell Biol. 2016 Feb;94(1):1-11. doi: 10.1139/bcb-2015-0065. Epub 2015 Jul 15. Biochem Cell Biol. 2016. PMID: 26352678 Review.
Cited by
-
CpG-binding protein CFP1 promotes ovarian cancer cell proliferation by regulating BST2 transcription.Cancer Gene Ther. 2022 Dec;29(12):1895-1907. doi: 10.1038/s41417-022-00503-z. Epub 2022 Jul 21. Cancer Gene Ther. 2022. PMID: 35864225 Free PMC article.
-
Functional Transcription Factor Target Networks Illuminate Control of Epithelial Remodelling.Cancers (Basel). 2020 Sep 30;12(10):2823. doi: 10.3390/cancers12102823. Cancers (Basel). 2020. PMID: 33007944 Free PMC article.
-
Genome-wide identification and characterisation of HOT regions in the human genome.BMC Genomics. 2016 Sep 15;17(1):733. doi: 10.1186/s12864-016-3077-4. BMC Genomics. 2016. PMID: 27633377 Free PMC article.
-
Comparative assessment of fluorescent proteins for in vivo imaging in an animal model system.Mol Biol Cell. 2016 Nov 7;27(22):3385-3394. doi: 10.1091/mbc.E16-01-0063. Epub 2016 Jul 6. Mol Biol Cell. 2016. PMID: 27385332 Free PMC article.
-
Identification of transcription factor high accumulation DNA zones.BMC Bioinformatics. 2023 Oct 20;24(1):395. doi: 10.1186/s12859-023-05528-1. BMC Bioinformatics. 2023. PMID: 37864168 Free PMC article.
References
-
- Ansari KI, Mishra BP, Mandal SS 2008. Human CpG binding protein interacts with MLL1, MLL2 and hSet1 and regulates Hox gene expression. Biochim Biophys Acta 1779: 66–73 - PubMed
-
- Antequera F, Bird A 1999. CpG islands as genomic footprints of promoters that are associated with replication origins. Curr Biol 9: R661–R667 - PubMed
-
- Bird AP 1986. CpG-rich islands and the function of DNA methylation. Nature 321: 209–213 - PubMed
Publication types
MeSH terms
Substances
Grants and funding
LinkOut - more resources
Full Text Sources
Other Literature Sources
Molecular Biology Databases
Research Materials
Miscellaneous