

Assessment of Particulate Matter Levels in Vulnerable Communities in North Charleston, South Carolina prior to Port Expansion
- PMID: 24653648
- PMCID: PMC3956811
- DOI: 10.4137/EHI.S12814
Assessment of Particulate Matter Levels in Vulnerable Communities in North Charleston, South Carolina prior to Port Expansion
Abstract
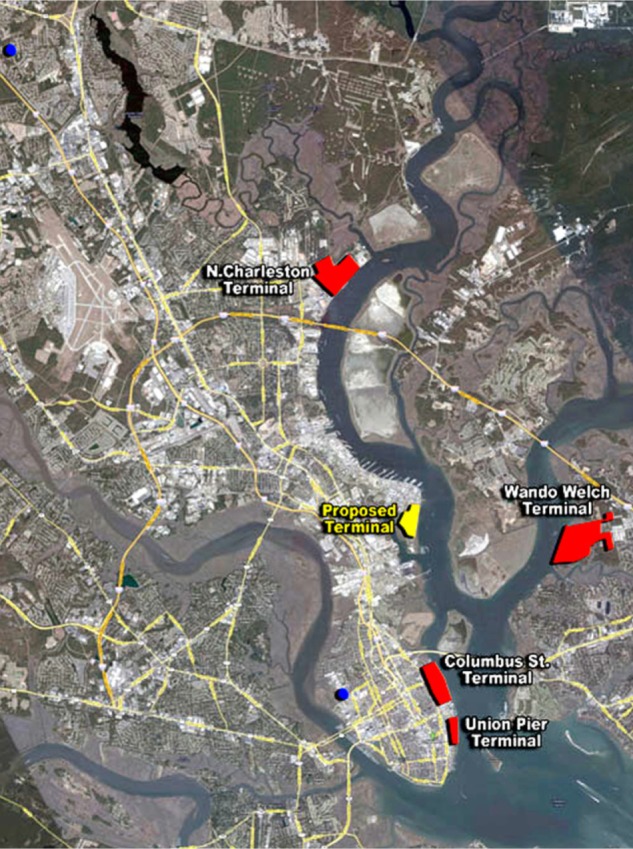
Introduction: The Port of Charleston, one of the busiest US ports, currently operates five terminals. The fifth terminal is being planned for expansion to accommodate container ships from the proposed Panama Canal expansion. Such expansion is expected to increase traffic within local vulnerable North Charleston neck communities by at least 7,000 diesel truck trips per day, more than a 70% increase from the present average rate of 10,000 trucks per day. Our objective was to measure the current particulate matter (PM) concentrations in North Charleston communities as a baseline to contrast against future air pollution after the proposed port expansion.
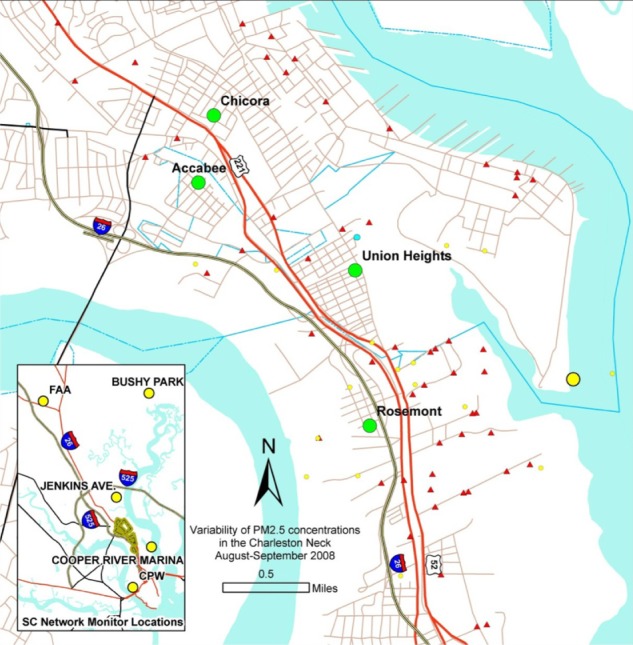
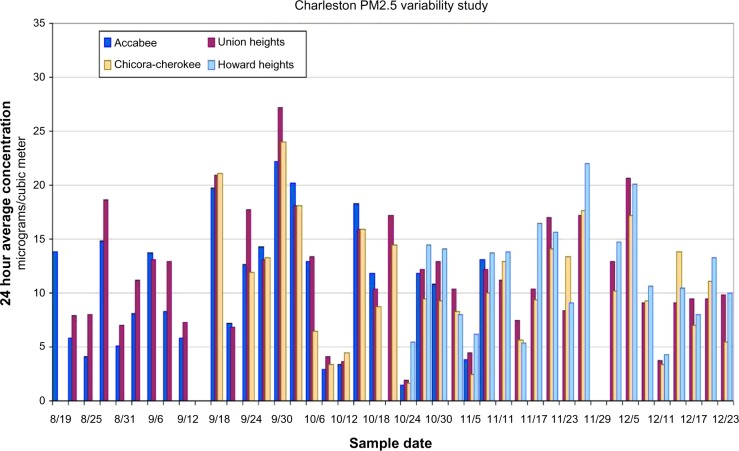
Methods: Saturation study was performed to determine spatial variability of PM in local Charleston neck communities. In addition, the temporal trends in particulate air pollution within the region were determined across several decades. With the BGI sampler, PM samples were collected for 24 hours comparable to the federal reference method protocol. Gravimetric analysis of the PM filter samples was conducted following EPA protocol.
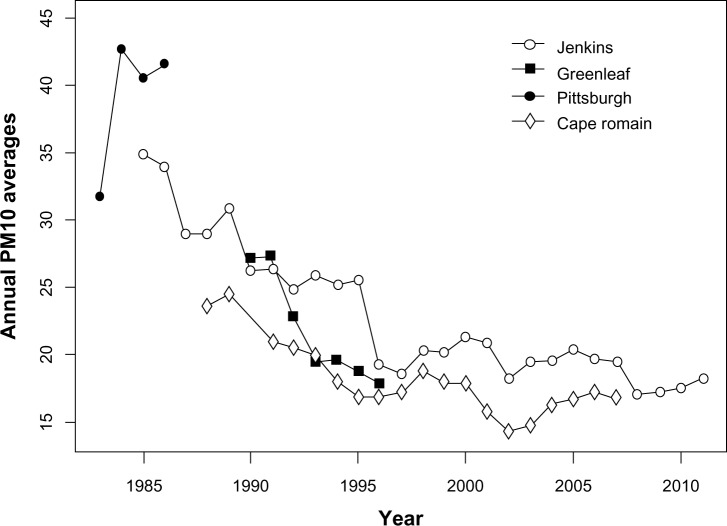
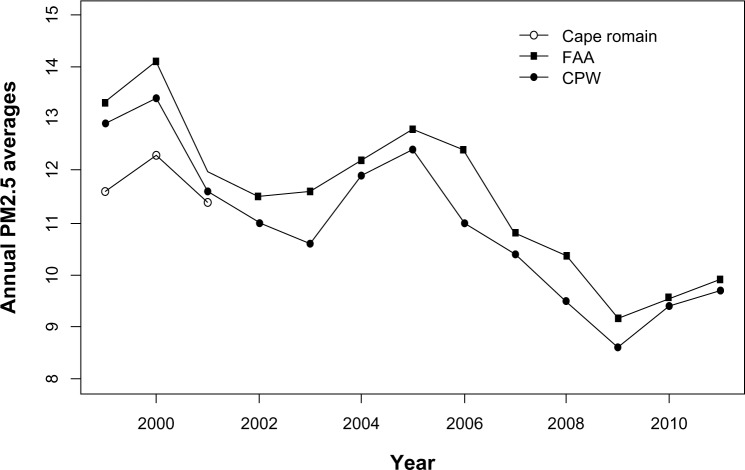
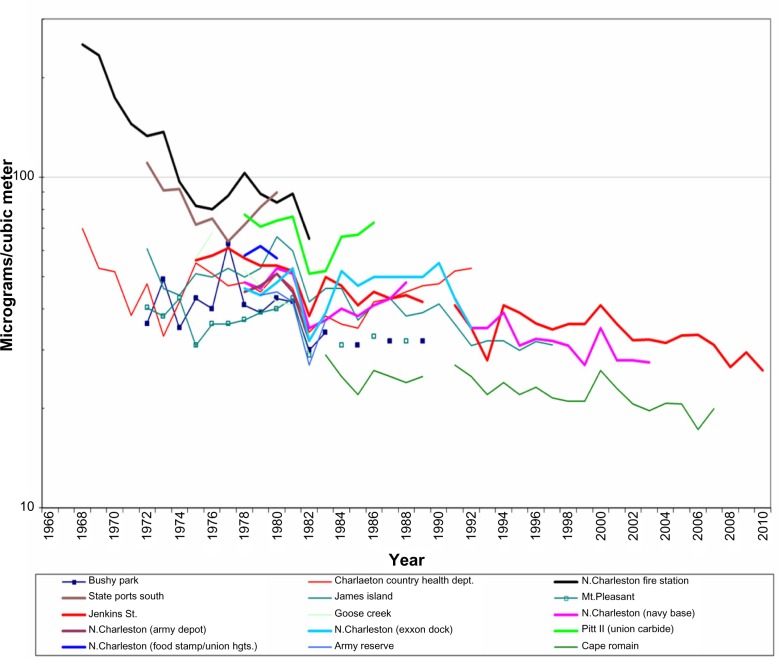
Results: The range of the PM10 annual average across the region from 1982 to 2006 was 17.0-55.0 μg/m3. On only two occasions were the records of PM10 averaged above the 50.0 μg/m3 national standard. In the case of PM2.5, the annual average for 1999-2006 ranged from 11.0 to 13.5 μg/m3 and no annual average exceeded the 15.0 μg/m3 PM2.5 annual standard.
Conclusions: Although ambient PM levels have fallen in the Charleston region since the 1960s due to aggressive monitoring by the stakeholders against air pollution, local air pollution sources within the North Charleston neck communities have consistently contributed to the PM levels in the region for several decades. This baseline assessment of ambient PM will allow for comparisons with future assessments to ascertain the impact of the increased truck and port traffic on PM concentrations.
Keywords: air pollution; air quality; community; environmental justice; particulate matter; port; urban.
Figures
Similar articles
-
Baseline Air Quality Assessment of Goods Movement Activities before the Port of Charleston Expansion: A Community-University Collaborative.Environ Justice. 2017 Feb 1;10(1):1-10. doi: 10.1089/env.2016.0018. Environ Justice. 2017. PMID: 29576842 Free PMC article.
-
The London low emission zone baseline study.Res Rep Health Eff Inst. 2011 Nov;(163):3-79. Res Rep Health Eff Inst. 2011. PMID: 22315924
-
Personal and ambient exposures to air toxics in Camden, New Jersey.Res Rep Health Eff Inst. 2011 Aug;(160):3-127; discussion 129-51. Res Rep Health Eff Inst. 2011. PMID: 22097188
-
Airborne particulate matter in Tehran's ambient air.J Environ Health Sci Eng. 2021 Jan 7;19(1):1179-1191. doi: 10.1007/s40201-020-00573-x. eCollection 2021 Jun. J Environ Health Sci Eng. 2021. PMID: 34150304 Free PMC article. Review.
-
Are current Chinese national ambient air quality standards on 24-hour averages for particulate matter sufficient to protect public health?J Environ Sci (China). 2018 Sep;71:67-75. doi: 10.1016/j.jes.2018.01.017. Epub 2018 Feb 11. J Environ Sci (China). 2018. PMID: 30195691 Review.
Cited by
-
Assessment of sociodemographic and geographic disparities in cancer risk from air toxics in South Carolina.Environ Res. 2015 Jul;140:562-8. doi: 10.1016/j.envres.2015.05.016. Epub 2015 May 28. Environ Res. 2015. PMID: 26037107 Free PMC article.
-
Air pollution exposure assessment at schools and playgrounds in Williamsburg Brooklyn NYC, with a view to developing a set of policy solutions.J Environ Stud Sci. 2022;12(4):838-852. doi: 10.1007/s13412-022-00777-7. Epub 2022 Jul 26. J Environ Stud Sci. 2022. PMID: 35910306 Free PMC article.
-
Community-based participatory research for the study of air pollution: a review of motivations, approaches, and outcomes.Environ Monit Assess. 2017 Aug;189(8):378. doi: 10.1007/s10661-017-6063-7. Epub 2017 Jul 6. Environ Monit Assess. 2017. PMID: 28685368 Review.
-
A critical review of an authentic and transformative environmental justice and health community--university partnership.Int J Environ Res Public Health. 2014 Dec 11;11(12):12817-34. doi: 10.3390/ijerph111212817. Print 2014 Dec. Int J Environ Res Public Health. 2014. PMID: 25514142 Free PMC article. Review.
References
-
- Stratton L. Charleston’s Dirty Little Secret; Don’t Breathe Deep—There are Killers Afloat Charleston City Paper. Nov 28, 2007. [Accessed September 2012]. Available from: http://www.charlestoncitypaper.com/charleston/charlestons-dirty-little-s....
-
- Sram RJ, Binkova B, Dostal M, et al. Health impact of air pollution to children. Int J Hyg Environ Health. 2013;216(5):533–40. - PubMed
-
- US Census Bureau Statistical abstracts of the United States. 2011. p. 683. Table 1086. Updated 2011.
-
- South Carolina DHEC Draft Environmental Impact Statement (EIS) for the Proposed Marine Container Terminal at the Charleston Naval Complex Appendix J Existing Roadway Traffic Study for North Charleston Study Area, Section. 2005;5:42. [10920 daily trips, 63%trucks(6879)] http://www.porteis.com/information/articles/2005_10_16.htm.
-
- SCDHEC. [Accessed October 24, 2013]. http://www.scdhec.gov/environment/baq/CharlestonNeckStudy/monitoring_dat.... Updated 2008.
Grants and funding
LinkOut - more resources
Full Text Sources
Other Literature Sources
Research Materials
