Multicenter Study
. 2014 Jan;4(1):29-40.
doi: 10.1002/brb3.185. Epub 2013 Nov 13.

Neuroanatomical correlates of cognitive functioning in prodromal Huntington disease

Affiliations
Multicenter Study

Neuroanatomical correlates of cognitive functioning in prodromal Huntington disease

Deborah L Harrington et al. Brain Behav. 2014 Jan.

Abstract

Introduction: The brain mechanisms of cognitive impairment in prodromal Huntington disease (prHD) are not well understood. Although striatal atrophy correlates with some cognitive abilities, few studies of prHD have investigated whether cortical gray matter morphometry correlates in a regionally specific manner with functioning in different cognitive domains. This knowledge would inform the selection of cognitive measures for clinical trials that would be most sensitive to the target of a treatment intervention.

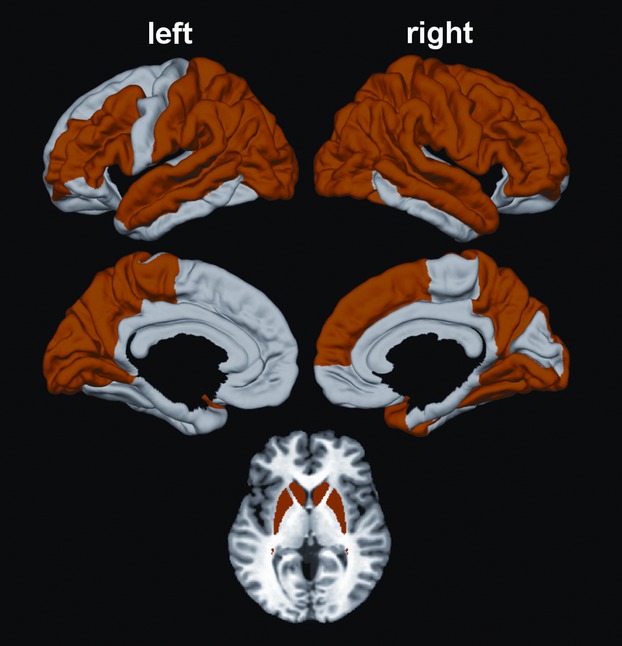
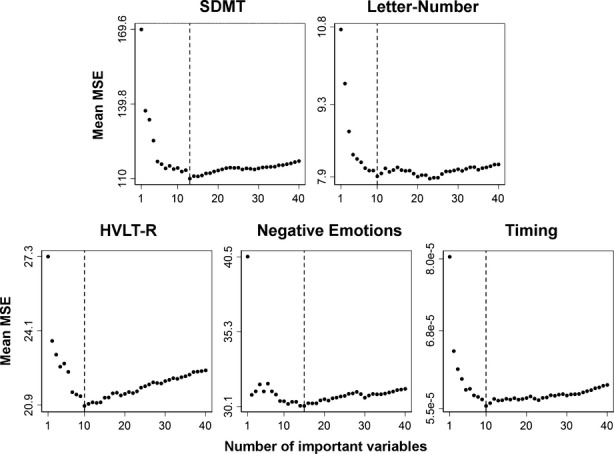
Method: In this study, random forest analysis was used to identify neuroanatomical correlates of functioning in five cognitive domains including attention and information processing speed, working memory, verbal learning and memory, negative emotion recognition, and temporal processing. Participants included 325 prHD individuals with varying levels of disease progression and 119 gene-negative controls with a family history of HD. In intermediate analyses, we identified brain regions that showed significant differences between the prHD and the control groups in cortical thickness and striatal volume. Brain morphometry in these regions was then correlated with cognitive functioning in each of the domains in the prHD group using random forest methods. We hypothesized that different regional patterns of brain morphometry would be associated with performances in distinct cognitive domains.

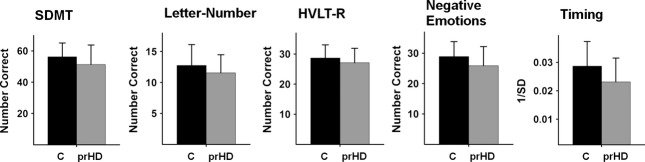
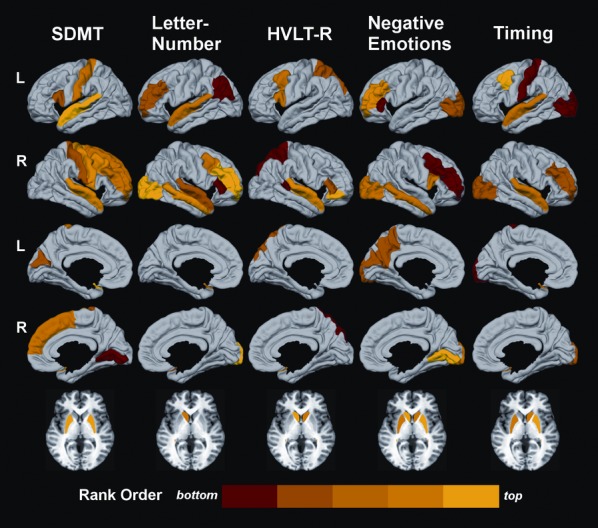
Results: The results showed that performances in different cognitive domains that are vulnerable to decline in prHD were correlated with regionally specific patterns of cortical and striatal morphometry. Putamen and/or caudate volumes were top-ranked correlates of performance across all cognitive domains, as was cortical thickness in regions related to the processing demands of each domain.

Conclusions: The results underscore the importance of identifying structural magnetic resonance imaging (sMRI) markers of functioning in different cognitive domains, as their relative sensitivity depends on the extent to which processing is called upon by different brain networks. The findings have implications for identifying neuroimaging and cognitive outcome measures for use in clinical trials.

Keywords: Cognition; magnetic resonance imaging; prodromal Huntington disease.


Figures

Figure 1
Figure 1
Mean (standard deviation) group performance on each of the cognitive measures. The gene-negative control group (C) performed significantly better than the prHD group on all cognitive measures (SDMT:P < 0.0025; letter-number sequencing: P < .013; HVLT-R:P < 0.037; negative emotions: P < 0.01; and timing: P < 0.002). prHD, prodromal Huntington disease; SDMT, Symbol Digits Modality Test; HVLT-R, Hopkins Verbal Learning Test-Revised.
Figure 2
Figure 2
Regions showing significant cortical thinning and striatal atrophy in the prodromal Huntington disease (prHD) group. Bilateral caudate and putamen atrophy were found in the prHD group. Cortical thinning was also found in 36 regions including areas of the frontal, superior and middle-temporal, and parietal-occipital cortices of both hemispheres on lateral and medial surfaces. These 40 regions were the predictor variables in the random forest analyses.
Figure 3
Figure 3
Number of top structural MRI (sMRI) correlates of performance for each cognitive measure. Each circle in the plot represents a sMRI predictor variable. The x axis shows the number of sMRI variables based on their mean squared error (MSE) ranking in the random forest analysis. The y axis represents the mean MSE value of the variables when the corresponding number of top sMRI predictors was included in the model. The lowest mean MSE is marked with a dashed line and signifies the number of top ranking variables that provided the most parsimonious correlation with performance on each cognitive measure. Negative emotions and SDMT performances were best associated with the highest ranked 15 and 13 sMRI variables, respectively. For the other cognitive variables, the 10 highest ranked sMRI variables resulted in the lowest mean MSE. An exception was for letter-number sequencing, in which the mean MSE was technically the lowest for the top-ranked 23 variables, but very close to the mean MSE corresponding to the top-ranked 10 sMRI variables. As such, the top 10 sMRI variables were selected for a more parsimonious interpretation.
Figure 4
Figure 4
Spatial maps of the top-ranked structural MRI (sMRI) correlates of performance in each cognitive domain. Cortical regions are displayed on the lateral (1st and 2nd rows) and medial (3rd and 4th rows) surfaces of the left (L) and right (R) hemispheres. The basal ganglia are shown at the bottom. The importance of a brain region in correlating with a cognitive measure is color coded on a continuum (red to yellow) according to the rank order of the mean square error (MSE) value for a sMRI variable, where larger MSEs signified greater importance. Yellow signifies a higher rank order of importance than red. Colors on the bar designate variables ranked in the top 20th (yellow) to the bottom 20th (red) percentile of the top-ranked sMRI predictors for each cognitive measure.

Similar articles

Cited by

References

    1. Adolphs R. Neural systems for recognizing emotion. Curr. Opin. Neurobiol. 2002;12:169–177. - PubMed
    1. Adolphs R, Tranel D, Hamann S, Young AW, Calder AJ, Phelps EA, et al. Recognition of facial emotion in nine individuals with bilateral amygdala damage. Neuropsychologia. 1999;37:1111–1117. - PubMed
    1. Aylward EH, Nopoulos PC, Ross CA, Langbehn DR, Pierson RK, Mills JA, et al. Longitudinal change in regional brain volumes in prodromal Huntington disease. J. Neurol. Neurosurg. Psychiatry. 2011;82:405–410. - PMC - PubMed
    1. Badre D. Cognitive control, hierarchy, and the rostro-caudal organization of the frontal lobes. Trends Cogn. Sci. 2008;12:193–200. - PubMed
    1. Bechtel N, Scahill RI, Rosas HD, Acharya T, Jauffret SJ, van den Bogaard C, et al. Tapping linked to function and structure in premanifest and symptomatic Huntington disease. Neurology. 2010;75:2150–2160. - PMC - PubMed

Publication types