Meta-Analysis
. 2014 May 15;74(10):2892-902.
doi: 10.1158/0008-5472.CAN-13-2775. Epub 2014 Mar 20.

A meta-analysis of lung cancer gene expression identifies PTK7 as a survival gene in lung adenocarcinoma

Affiliations
Meta-Analysis

A meta-analysis of lung cancer gene expression identifies PTK7 as a survival gene in lung adenocarcinoma

Ron Chen et al. Cancer Res. .

Abstract

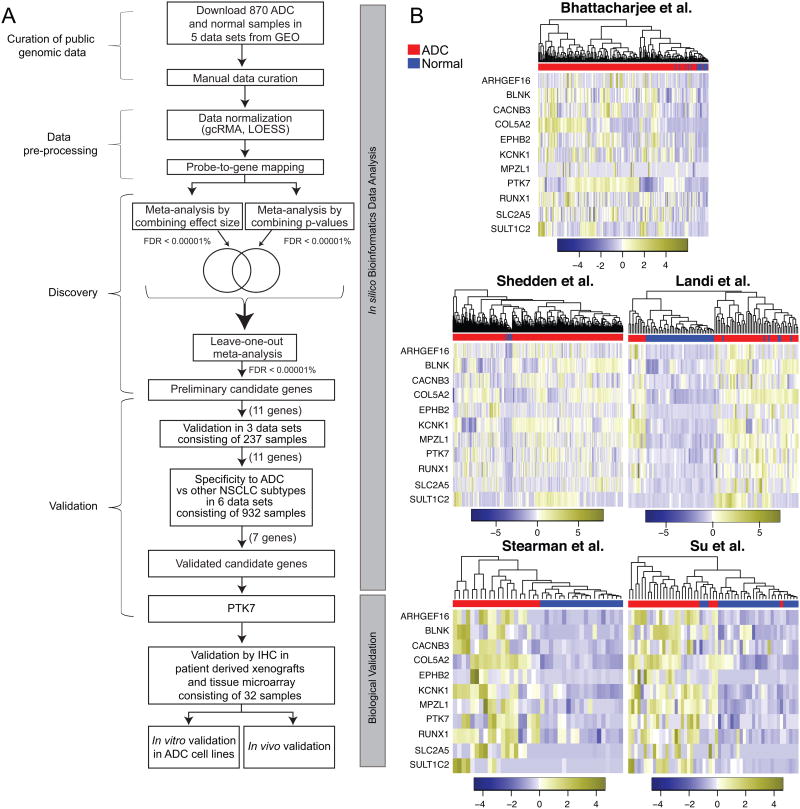
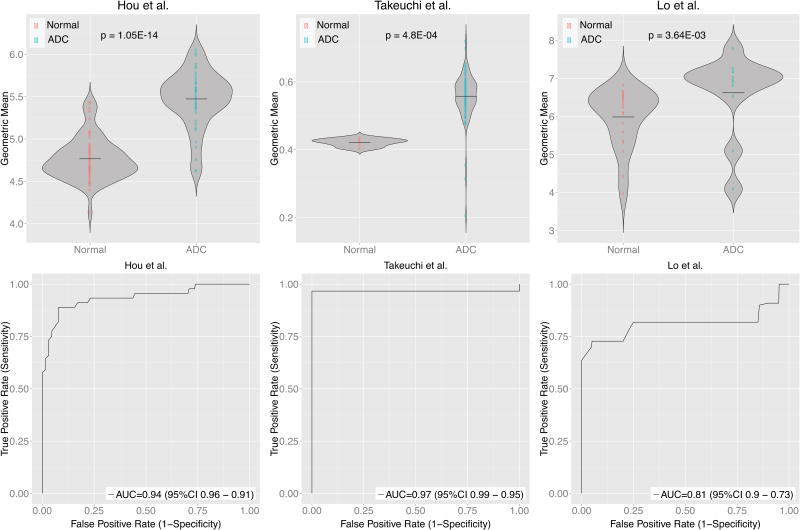
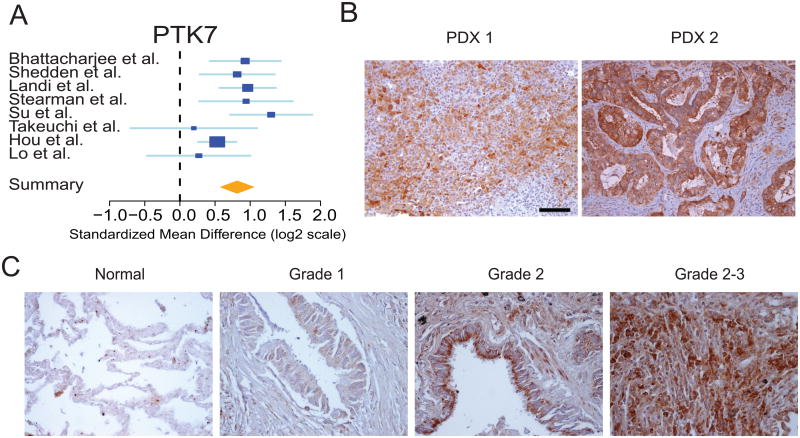
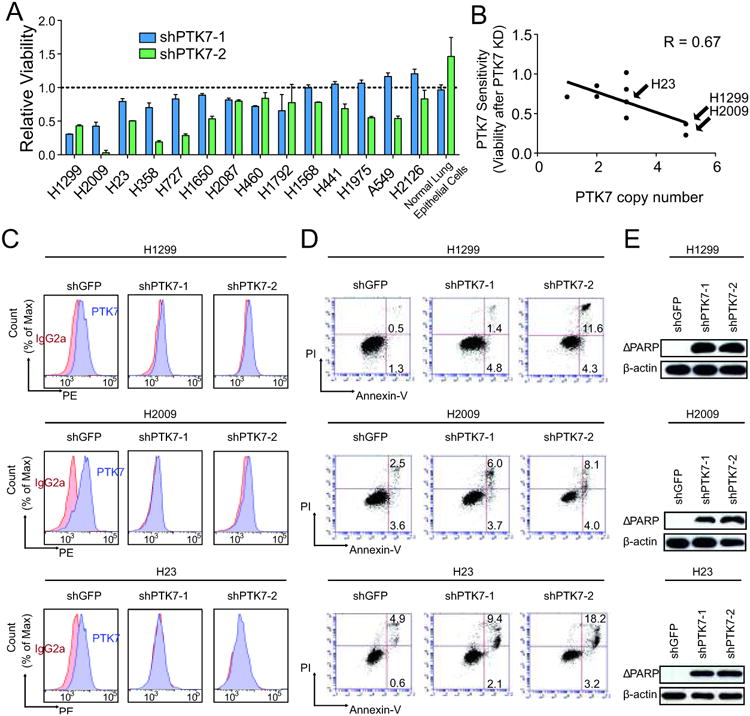
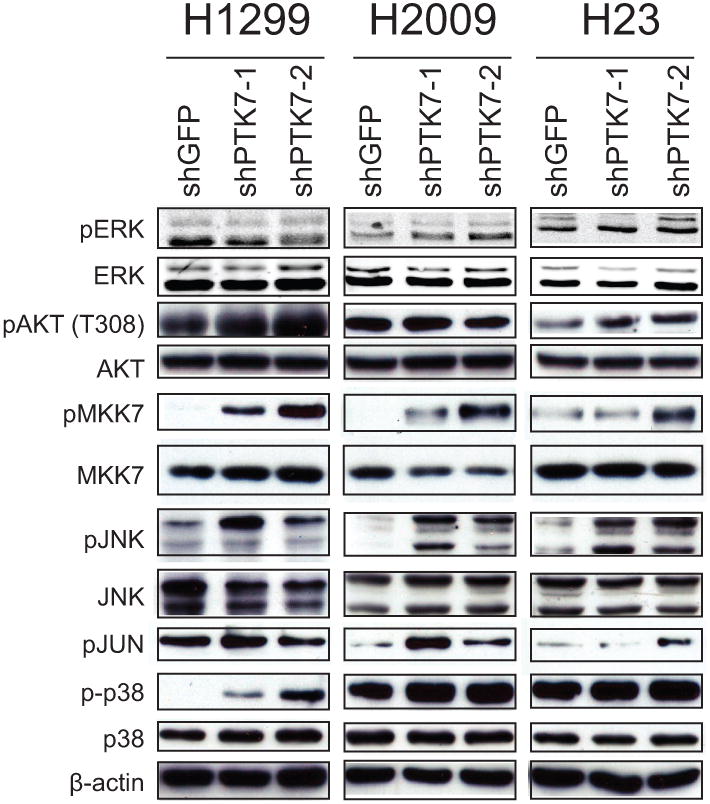
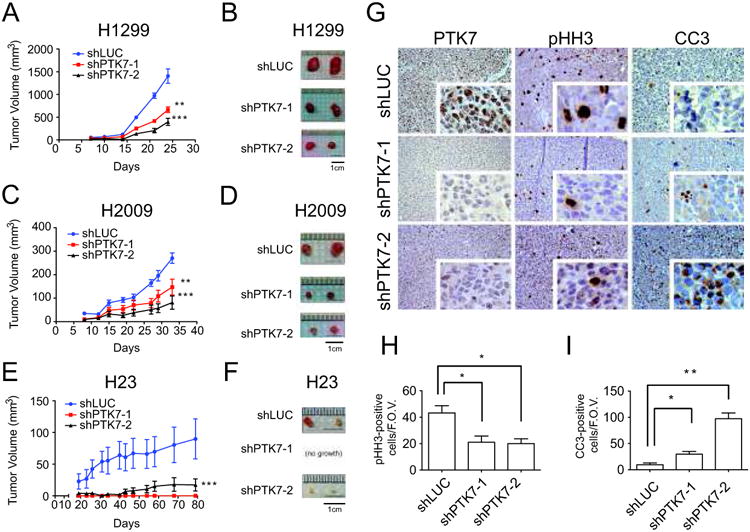
Lung cancer remains the most common cause of cancer-related death worldwide and it continues to lack effective treatment. The increasingly large and diverse public databases of lung cancer gene expression constitute a rich source of candidate oncogenic drivers and therapeutic targets. To define novel targets for lung adenocarcinoma, we conducted a large-scale meta-analysis of genes specifically overexpressed in adenocarcinoma. We identified an 11-gene signature that was overexpressed consistently in adenocarcinoma specimens relative to normal lung tissue. Six genes in this signature were specifically overexpressed in adenocarcinoma relative to other subtypes of non-small cell lung cancer (NSCLC). Among these genes was the little studied protein tyrosine kinase PTK7. Immunohistochemical analysis confirmed that PTK7 is highly expressed in primary adenocarcinoma patient samples. RNA interference-mediated attenuation of PTK7 decreased cell viability and increased apoptosis in a subset of adenocarcinoma cell lines. Further, loss of PTK7 activated the MKK7-JNK stress response pathway and impaired tumor growth in xenotransplantation assays. Our work defines PTK7 as a highly and specifically expressed gene in adenocarcinoma and a potential therapeutic target in this subset of NSCLC.


Conflict of interest statement

Declaration of conflict of interest: the authors declare no conflict of interest.

Figures

Figure 1
Figure 1
Meta-analysis of NSCLC gene expression datasets identified 11 significantly over-expressed genes in NSCLC. A. Meta-analysis and functional validation pipeline. In silico bioinformatics data analysis workflow consisted of the curation of five publically available datasets, data pre-processing, discovery meta-analysis, independent validation, and subtype analysis followed by validation in primary human patient samples, and in vitro and in vivo functional validation. B. The 11 genes cluster ADC vs. normal across each independent dataset. Each column is a sample and each row is the expression level of a gene. The color scale represents the raw Z-score ranging from blue (low expression) to yellow (high expression). Dendrograms above each heatmap correspond to the Pearson correlation-based hierarchical clustering of samples by expression of the 11 genes.
Figure 2
Figure 2
Eleven genes were significantly over-expressed in three independent ADC gene expression data sets. A. The 11 genes cluster ADC vs normal in three independent ADC data sets. Each column is a sample and each row is the expression level of a gene. The color scale represents the raw Z-score ranging from blue (low expression) to yellow (high expression). Dendrograms above each heatmap correspond to the Pearson correlation-based hierarchical clustering of samples by expression of the 11 genes. B. Swarm plots summarizing the normal and ADC expression values (log2) by geometric mean of the 11-gene signature. C. Performance of a univariate classification model for predicting ADC vs normal based on gene expression of the 11-gene signature across the independent datasets measured by ROC curves. AUC is area under the curve.
Figure 3
Figure 3
PTK7 is over-expressed in human ADC. A. Forest plot of PTK7 expression across all discovery and validation meta-analysis datasets. The x-axis is the standardized mean difference between ADC and normal on a log2 scale. Thus, a value of 1 signifies a 2-fold difference in gene expression between cancer and normal. B. Representative images of PTK7 expression in two patient-derived xenograft (PDX) specimens. C. Representative images of PTK7 staining of normal lung and ADC spanning grades 1-3. Scale bars represent 50μm.
Figure 4
Figure 4
Disruption of PTK7 in three NSCLC cell lines leads to a decrease cell viability and increase in apoptosis. A. Knock-down of PTK7 with two independent hairpins across a panel of NSCLC cell lines and assessment of cell viability by MTT. B. Scatter plot of PTK7 sensitivity vs copy number in the panel of cell lines. PTK7 sensitivity was calculated by averaging the relative viability across both hairpins after PTK7 knock-down. Copy number at the 6p21 PTK7 locus was queried in the Sanger COSMIC database. R represents the linear correlation coefficient. C. PTK7 knock-down validation by FACS. D. FACS analysis of Annexin-V-positive cells. E. Cleaved poly (ADP-ribose) polymerase (ΔPARP) immunoblotting and β-actin loading control.
Figure 5
Figure 5
PTK7 regulates MKK7-JNK signaling. Assessment of the ERK, AKT, JNK, and p38 signaling pathways by immunoblotting in three NSCLC cell lines.
Figure 6
Figure 6
PTK7 depletion in three NSCLC cell lines decreases tumor burden in a xenotransplantation assay. A. Tumor volume over time of xenografted H1299 with control shRNA against luciferase (shLUC), or 2 independent hairpins against PTK7. Error bars represent standard error of the mean (s.e.m) and significant p-values correspond to <0.01 (**) or <0.001 (***) when compared to the shLUC control. Values are mean ± SEM (n = 4-8). B. Representative ex vivo images of H1299 tumors. C and D. Same figures for H2009 cell line. E and F. Same figures for H23 cell line. G. Staining of PTK7, pHH3 and CC3 by IHC in the H1299 xenografts. H. Quantification of pHH3-positive cells per field of view (n=6) I. Quantification of CC3-positive cells per field of view (n=6).

References

    1. Howlader NNA, Krapcho M, Neyman N, Aminou R, Altekruse SF, Kosary CL, Ruhl J, Tatalovich Z, Cho H, Mariotto A, Eisner MP, Lewis DR, Chen HS, Feuer EJ, Cronin KA, editors. SEER Cancer Statistics Review, 1975-2009 (Vintage 2009 Populations) [accessed August 13, 2012]; http://seer.cancer.gov/csr/1975_2009_pops09/index.html.
    1. Keedy VL, Temin S, Somerfield MR, et al. American Society of Clinical Oncology provisional clinical opinion: epidermal growth factor receptor (EGFR) Mutation testing for patients with advanced non-small-cell lung cancer considering first-line EGFR tyrosine kinase inhibitor therapy. Journal of clinical oncology: official journal of the American Society of Clinical Oncology. 2011;29:2121–2127. - PubMed
    1. Soda M, Choi YL, Enomoto M, et al. Identification of the transforming EML4-ALK fusion gene in non-small-cell lung cancer. Nature. 2007;448:561–566. - PubMed
    1. Pao W, Hutchinson KE. Chipping away at the lung cancer genome. Nature medicine. 2012;18:349–351. - PubMed
    1. Sorlie T, Tibshirani R, Parker J, et al. Repeated observation of breast tumor subtypes in independent gene expression data sets. Proceedings of the National Academy of Sciences of the United States of America. 2003;100:8418–8423. - PMC - PubMed

Publication types

Substances