Loss of CPSF2 expression is associated with increased thyroid cancer cellular invasion and cancer stem cell population, and more aggressive disease
- PMID: 24654752
- PMCID: PMC4079301
- DOI: 10.1210/jc.2013-4140
Loss of CPSF2 expression is associated with increased thyroid cancer cellular invasion and cancer stem cell population, and more aggressive disease
Abstract
Purpose: Identification of molecular factors that promote thyroid cancer progression have important clinical implications for therapy and prognostication in patients with papillary thyroid cancer (PTC). The aim of this study was to validate and determine the function of dysregulated genes that were associated increased mortality in patients with PTC. Experiemental Design: We selected the cleavage and polyadenylation specificity factor subunit 2 (CPSF2) gene from the top 5 significantly dysregulated genes associated with PTC-associated mortality from our previous study. We used 86 PTC samples enriched for aggressive disease (recurrence and mortality) by quantitative RT-PCR (qRT-PCR). In vitro functional studies of the validated gene were performed.
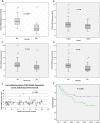
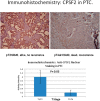
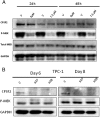
Results: Decreased CPSF2 gene expression was associated with shorter disease-free survival (P = .03), large tumor size (T3 and T4) (P = .03), tumor recurrence (P < .01), and mortality (P < .01), independent of BRAF V600E mutation status. CPSF2 knockdown increased cellular invasion by 1.8- to 3.2-fold (P < .01) and increased markers of thyroid cancer stem cells (CD44 and CD133 expression). Immunohistochemistry showed an inverse correlation between CD44 protein expression in PTC samples and CPSF2 expression.
Conclusion: Decreased CPSF2 expression is associated with increased cellular invasion and cancer stem cell population, and more aggressive disease in PTC.
Figures


References
-
- Cady B, Rossi R. An expanded view of risk-group definition in differentiated thyroid carcinoma. Surgery. 1988;104:947–953 - PubMed
-
- Davies L, Welch HG. Increasing incidence of thyroid cancer in the United States, 1973–2002. JAMA. 2006;295:2164–2167 - PubMed
-
- Howlader NNA, Krapcho M, Garshell J, et al. 2012 SEER Cancer Statistics Review, 1975–2010, National Cancer Institute; Bethesda, MD, http://seer.cancer.gov/archive/csr/1975_2010/, based on November 2012 SEER data submission, posted to the SEER web site, 2013
-
- Nikiforova MN, Nikiforov YE. Molecular diagnostics and predictors in thyroid cancer. Thyroid. 2009;19:1351–1361 - PubMed
-
- Puxeddu E, Moretti S, Elisei R, et al. BRAF(V599E) mutation is the leading genetic event in adult sporadic papillary thyroid carcinomas. J Clin Endocrinol Metab. 2004;89:2414–2420 - PubMed
Publication types
MeSH terms
Substances
Grants and funding
LinkOut - more resources
Full Text Sources
Other Literature Sources
Medical
Research Materials
Miscellaneous

