. 2014 Aug;13(4):631-40.
doi: 10.1111/acel.12216. Epub 2014 Mar 21.

Relative importance of redox buffers GSH and NAD(P)H in age-related neurodegeneration and Alzheimer disease-like mouse neurons

Affiliations

Relative importance of redox buffers GSH and NAD(P)H in age-related neurodegeneration and Alzheimer disease-like mouse neurons

Debolina Ghosh et al. Aging Cell. 2014 Aug.

Abstract

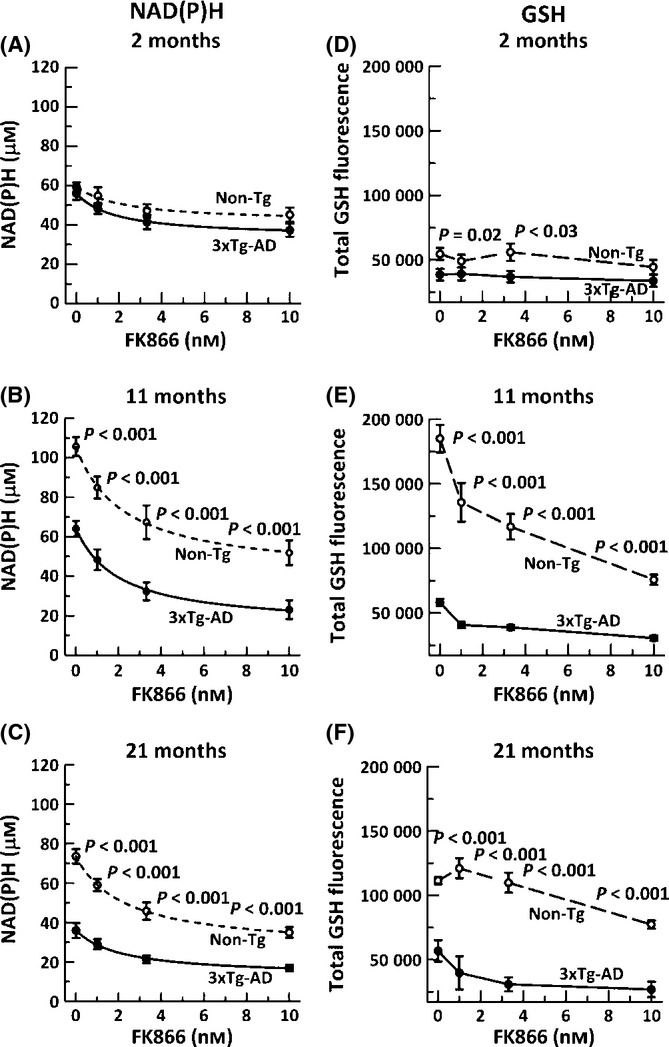
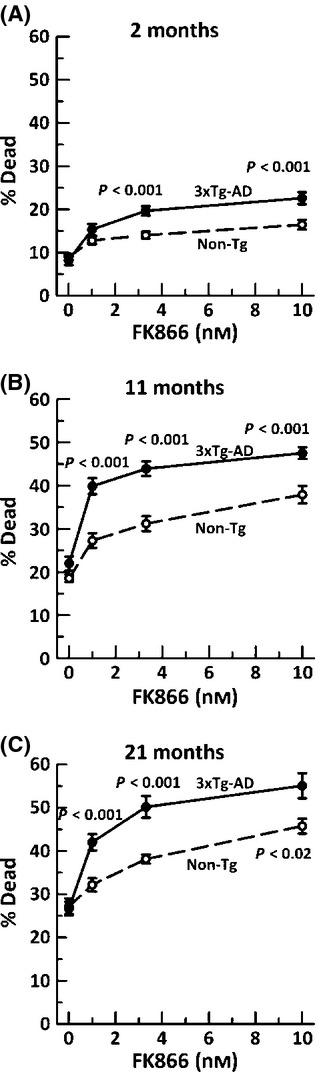
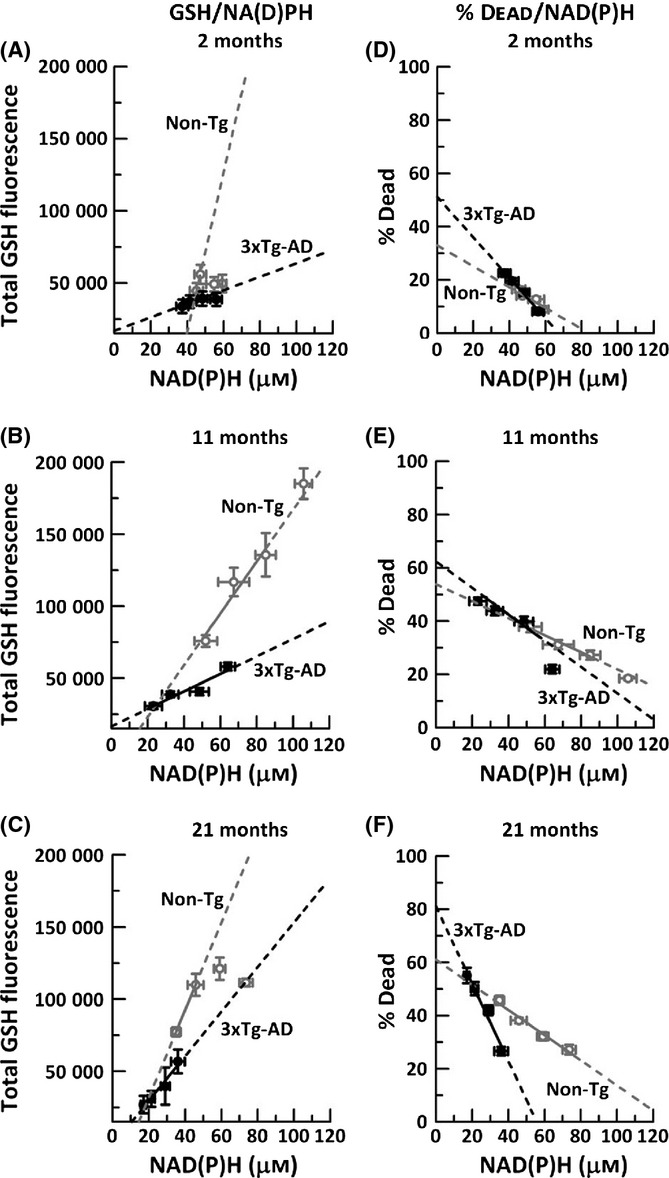
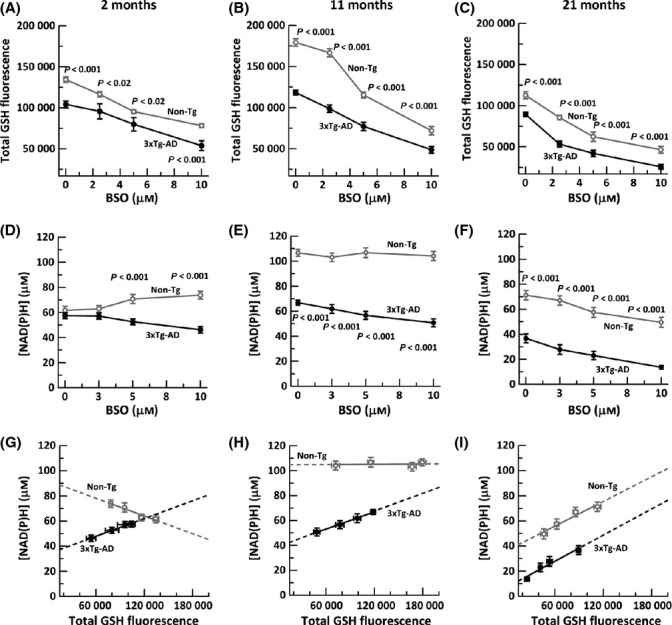
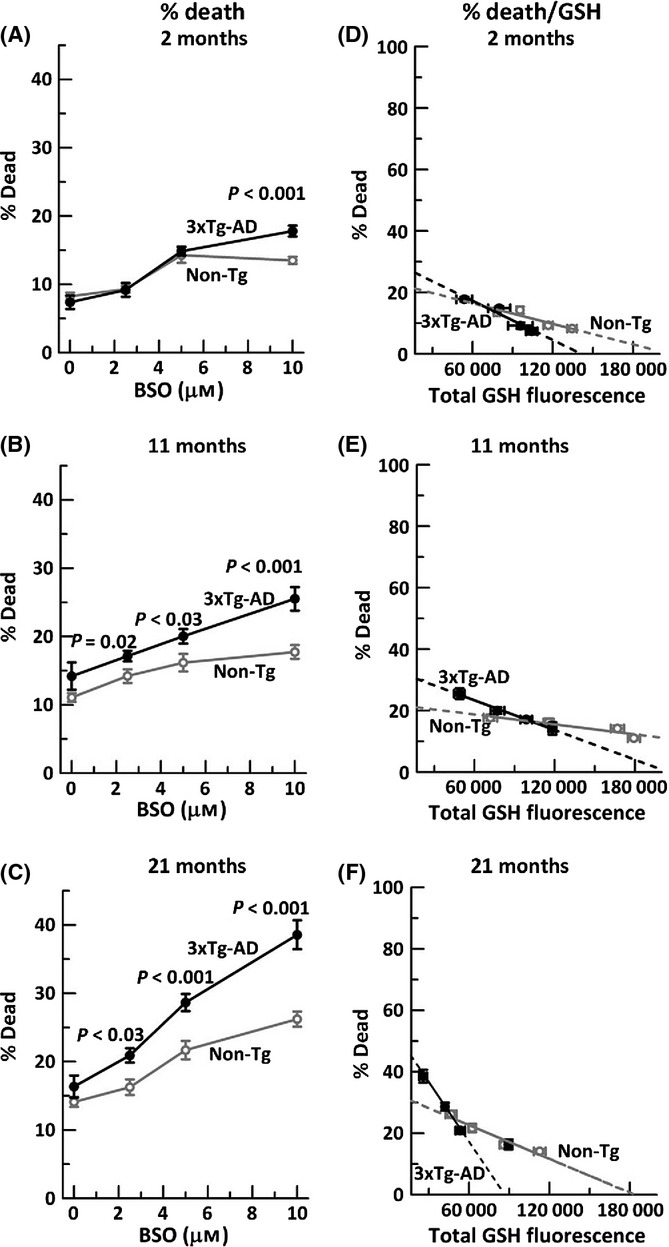
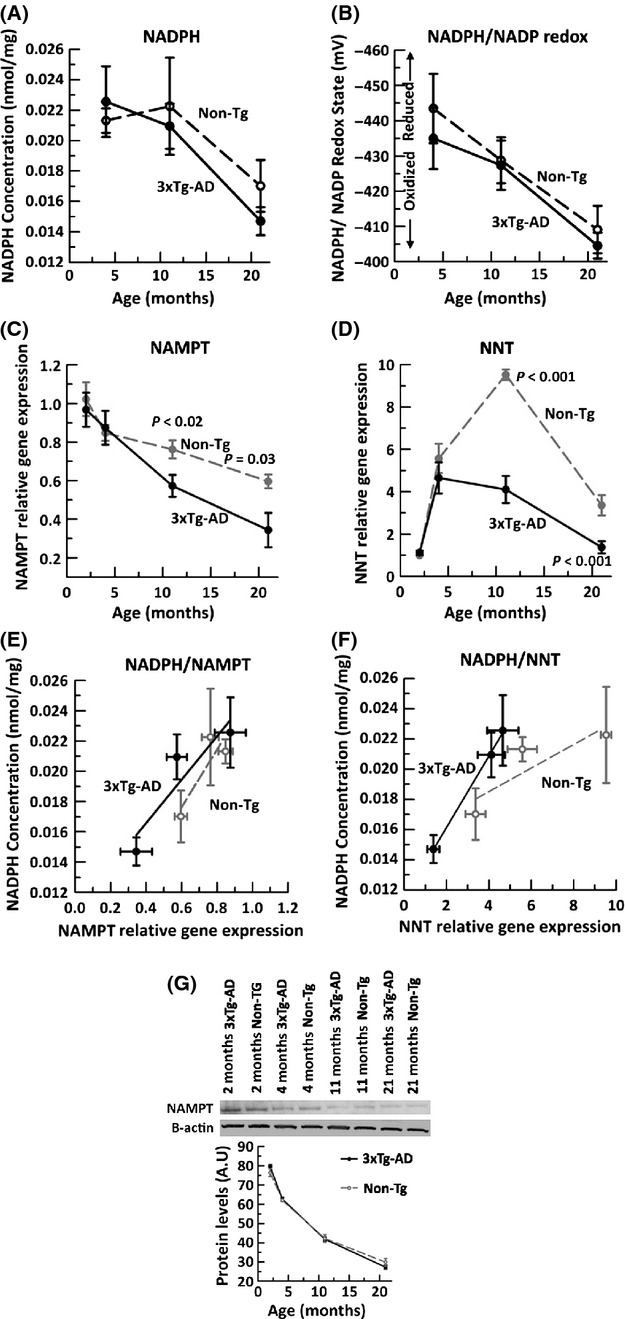
Aging, a major risk factor in Alzheimer's disease (AD), is associated with an oxidative redox shift, decreased redox buffer protection, and increased free radical reactive oxygen species (ROS) generation, probably linked to mitochondrial dysfunction. While NADH is the ultimate electron donor for many redox reactions, including oxidative phosphorylation, glutathione (GSH) is the major ROS detoxifying redox buffer in the cell. Here, we explored the relative importance of NADH and GSH to neurodegeneration in aging and AD neurons from nontransgenic and 3xTg-AD mice by inhibiting their synthesis to determine whether NADH can compensate for the GSH loss to maintain redox balance. Neurons stressed by either depleting NAD(P)H or GSH indicated that NADH redox control is upstream of GSH levels. Further, although depletion of NAD(P)H or GSH correlated linearly with neuron death, compared with GSH depletion, higher neurodegeneration was observed when NAD(P)H was extrapolated to zero, especially in old age, and in the 3xTg-AD neurons. We also observed an age-dependent loss of gene expression of key redox-dependent biosynthetic enzymes, NAMPT (nicotinamide phosphoribosyltransferase), and NNT (nicotinamide nucleotide transhydrogenase). Moreover, age-related correlations between brain NNT or NAMPT gene expression and NADPH levels suggest that these genes contribute to the age-related declines in NAD(P)H. Our data indicate that in aging and more so in AD-like neurons, NAD(P)H redox control is upstream of GSH and an oxidative redox shift that promotes neurodegeneration. Thus, NAD(P)H generation may be a more efficacious therapeutic target upstream of GSH and ROS.

Keywords: 3xTg-AD; NAD(P)H; aging; glutathione; neurodegeneration; redox.


Figures

Figure 1
Figure 1
Inhibition of NAMPT decreases NAD(P)H and glutathione levels in both non-Tg and 3xTg-AD neurons. NAMPT inhibitory doses of FK866 decreased NAD(P)H levels in non-Tg (open circle, dashed line) and 3xTg-AD (filled circles, solid line) neurons in A) 2-month (ANOVA genotype F(1,116) = 4.3, P = 0.04, FK866 F(3,116) = 6.9, P < 0.001, B) 11-month (ANOVA genotype F(1,59) = 82, P < 0.001, FK866 F(3,59) = 26, P < 0.001), and C) 21-month (ANOVA genotype F(1,108) = 149, P < 0.001, FK866 F(3,108) = 31, P < 0.001) mice. n = 15–20 neurons from 3–4 mice per age per genotype. Effects of the same dose-dependent inhibition of NAMPT on GSH levels were small at D) 2 months, (ANOVA genotype F(1,56) = 11, P = 0.001, FK866 F(3,56) = 0.7, P = 0.57), but significantly decreased glutathione at E) 11 months (ANOVA genotype F(1,112) = 72, P < 0.001, FK866 F(3,112) = 46, P < 0.001), and F) 21 months (ANOVA genotype F(1,117) = 28, P < 0.001, FK866 F(3,117) = 128, P < 0.001) in non-Tg (open circle, dashed lines) or 3xTg-AD (filled circle, solid line). n > 350 neurons from 3–4 mice per age per genotype.
Figure 2
Figure 2
Increased neuron death with age subsequent to NAD(P)H depletion in both non-Tg (black open circle, dashed lines) and 3xTg-AD (black filled circle, solid line) neurons from A) 2-month mice, (ANOVA genotype F(1,120) = 19, P < 0.001, FK866 F(3,120) = 37, P < 0.001), B) 11-month mice, (ANOVA genotype F(1,129) = 42, P < 0.001, FK866 F(3,129) = 73, P < 0.001), or C) 21-month mice, (ANOVA genotype F(1,76) = 34, P < 0.001, FK866 F(3,76) = 53, P < 0.001). n = 15–20 neurons from 3–4 animals per age and genotype.
Figure 3
Figure 3
GSH levels and neurodegeneration are highly dependent on NAD(P)H levels. A–C, GSH dependence with controlled decrements in NAD(P)H; D–F, effects of these decrements on neuron death. Extrapolation of non-Tg (gray open circles, dashed lines) and 3xTg-AD to zero GSH in A) 2-month neurons (R2 for non-Tg = 0.82, 3xTg-AD = 0.83), B) 11-month neurons (R2 for non-Tg = 0.94, 3xTg-AD = 0.9), and C) 21-month neurons (R2 for non-Tg = 0.734, 3xTg-AD = 0.95). Note that linear fits for 2-month and 21-month non-Tg neurons excluded several high GSH values because they were unaffected by decrements in NAD(P)H. Similarly, neurodegeneration increases with decrements in NAD(P)H in both genotypes, in D) 2-month neurons (non-Tg slope = −0.44;R2 = 0.89, 3xTg-AD slope = −0.76; R2 = 0.99), E) 11-month neurons (non-Tg slope = −0.35; R2 = 0.99, 3xTg-AD slope = −0.59; R2 = 0.89, and F) 21-month (non-Tg slope = −0.47; R2 = 0.97, 3xTg-AD slope = −1.46; R2 = 0.97). n = 3–4 animals per genotype per age.
Figure 4
Figure 4
Inhibition of GSH synthesis gradually alters NAD(P)H levels depending on age with decrements in the 3xTg-AD neurons similar to old non-Tg neurons. A) Titration of glutathione levels with indicated BSO concentrations in non-Tg (gray open circle, gray solid line) and 3xTg-AD mice (black filled circle, black solid line) in 2-month (ANOVA genotype F(1,104) = 9.9, P < 0.03, BSO F(3,104) = 48, P < 0.001), B)11-month neurons (ANOVA genotype F(1,119) = 128, P < 0.001, BSO F(3,119) = 89, P < 0. 001), and C) 21-month neurons (ANOVA genotype F(1,109) = 37, P < 0.001, BSO F(3,109) = 54, P < 0. 001). n = 250–300 neurons from 3–4 animals per age per genotype. Neuronal NAD(P)H levels in non-Tg neurons remain unaffected by GSH loss at D) 2 months (ANOVA genotype F(1,86) = 50, P < 0.001, BSO F(3,86) = 0.4, P = 0.75) and E) 11 months (ANOVA genotype F(1,106) = 403, P < 0.001, BSO F(3,106)=2.7, P = 0.051), but decline gradually at F) 21 month (ANOVA genotype F(1,112) = 208, P < 0.0001, BSO F(3,112) = 15, P < 0.0001). In significantly different 3xTg-AD neurons, decrements in GSH cause small reductions in NAD(P)H levels at all ages. Tight linear fits indicate direct relationships of NAD(P)H to GSH, but NAD(P)H concentration as a function of extrapolated zero GSH levels in neurons from G) 2-month mice non-Tg slope = −0.0002, intercept 92 μm NAD(P)H (R2 = 0.97); 3xTg-AD slope = 0.0002, intercept 33 μm NAD(P)H (R2 = 0.92), H) 11-month non-Tg slope = 0.00, intercept 105 μm NAD(P)H (R2 = 0.01); 3xTg-AD slope = 0.0002, intercept 39 μm NAD(P)H (R2 = 0.99), and I) 21-month non-Tg slope = 0.0003, intercept 36 μm NAD(P)H (R2 = 0.95; 3xTg-AD slope = 0.0003, intercept 7 μm NAD(P)H (R2 = 0.95). Extrapolations onto the y-axis for total depletion of GSH suggests that viable neurons can be depleted of GSH but not NAD(P)H. n = 16–20 neurons from 3–4 animals per age per genotype.
Figure 5
Figure 5
Neurodegeneration due to glutathione depletion increases gradually with age, more so in 3xTg-AD neurons. Glutathione depletion with indicated BSO stress in A) 2-month neurons, (ANOVA genotype F(1,139) = 4.4, P = 0.04, BSO F(3,139) = 57, P < 0.001), B) 11-month neurons (ANOVA genotype F(1,142) = 26, P < 0.001, BSO F(3,142) = 18, P < 0.001), and C) 21-month neurons (ANOVA genotype F(1,143) = 22, P < 0.001, BSO F(3,143) = 51, P < 0.001). n = 250–300 neurons from 3–4 mice per age per genotype. Neuron death with GSH depletion and extrapolation to zero GSH levels in neurons from D) 2-month non-Tg mice slope = −0.0001 (R2 = 0.83); 3xTg-AD slope = −0.0002 (R2 = 0.97), E) 11-month non-Tg slope = −0.00005 (R2 = 0.87), 3xTg-AD slope = −0.0001 (R2 = 0.99) and F) 21-month non-Tg slope = −0.0001 (R2 = 0.94), 3xTg-AD slope = −0.0003 (R2 = 0.85). n = 3–4 animals per age per genotype.
Figure 6
Figure 6
Brain NADPH concentration and NADPH/NADP redox state decline with age and correlate with decline in brain expression of NAMPT and NNT gene expression. By HPLC analysis of cortical/hippocampal tissue homogenates from 4-, 11- and 21-month non-Tg (dashed line) and 3xTg-AD (solid line), A) NADPH concentration (nmol/mg) declines with age (ANOVA F(2,24) = 10.4, P = 0.001). B) Calculated NADPH/NADP redox state (mV) using the Nernst equation indicates a large oxidative shift in both non-Tg and 3xTg-AD brain with age (ANOVA F(2,24) = 15.7, P = 0.001). qRT PCR on non-Tg (gray filled circle, dashed line) and 3xTg-AD (black filled circle, solid line) brains indicate an age- and AD-related loss in gene expression of metabolic enzymes C) NAMPT (ANOVA, age F(3,33) = 21.8, P < 0.001, genotype F(1,33)=6.6, P = 0.02), and D) NNT (ANOVA age F(3,33) = 64.08, P < 0.001, genotype F(1,33) = 32.417, P < 0.001). Fold change expressed relative to 2 month non-Tg GAPDH as internal control. Brain NADPH levels correlate with E) NAMPT (non-Tg R2 = 0.76, 3xTg-AD R2 = 0.84) and F) NNT (non-Tg R2 = 0.76, 3xTg-AD R2 = 0.99). n = 4–7 animals per age per genotype. (G) Analysis of NAMPT protein by immunoblot indicates a larger decline with age than for mRNA and no genotype difference (n = 4 brains from each mouse).

References

    1. Ansari MA, Scheff SW. Oxidative stress in the progression of Alzheimer disease in the frontal cortex. J. Neuropath. Exp. Neurol. 2010;69:155–167. - PMC - PubMed
    1. Brewer GJ. Epigenetic oxidative redox shift (EORS) theory of aging unifies the free radical and insulin signaling theories. Exp. Gerontol. 2010;45:173–179. - PMC - PubMed
    1. Brewer GJ, Torricelli JR. Isolation and culture of adult neurons and neurospheres. Nat. Protoc. 2007;2:1490–1498. - PubMed
    1. Brewer GJ, Torricelli JR, Lindsey AL, Kunz EZ, Neuman A, Fisher DR, Joseph JA. Age-related toxicity of amyloid-beta associated with increased pERK and pCREB in primary hippocampal neurons: reversal by blueberry extract. J. Nutr. Biochem. 2010;21:991–998. - PMC - PubMed
    1. Bubber P, Haroutunian V, Fisch G, Blass JP, Gibson GE. Mitochondrial abnormalities in Alzheimer brain: mechanistic implications. Ann. Neurol. 2005;57:695–703. - PubMed

Publication types

MeSH terms