. 2014 Mar 18;106(6):1280-9.
doi: 10.1016/j.bpj.2014.01.006.

Structural determinants of water permeation through the sodium-galactose transporter vSGLT

Affiliations

Structural determinants of water permeation through the sodium-galactose transporter vSGLT

Joshua L Adelman et al. Biophys J. .

Abstract

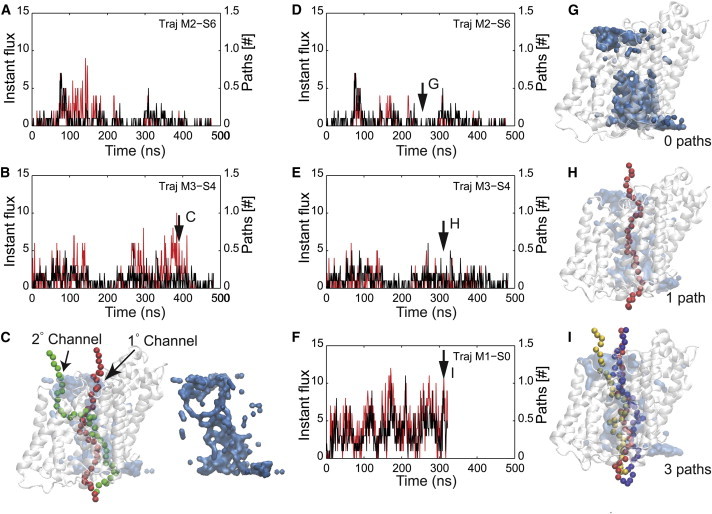
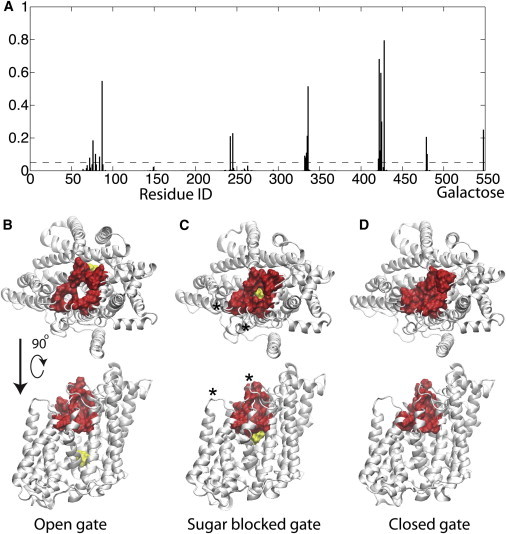
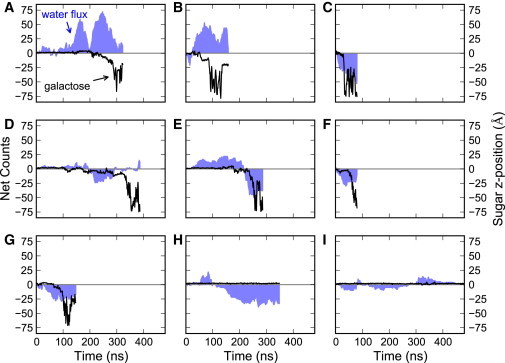
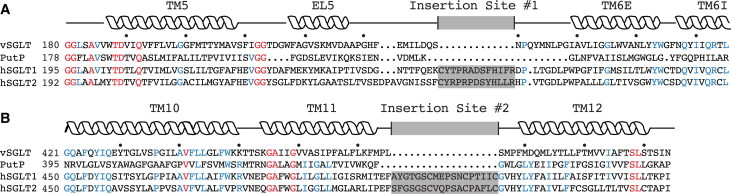
Sodium-glucose transporters (SGLTs) facilitate the movement of water across the cell membrane, playing a central role in cellular homeostasis. Here, we present a detailed analysis of the mechanism of water permeation through the inward-facing state of vSGLT based on nearly 10 μs of molecular dynamics simulations. These simulations reveal the transient formation of a continuous water channel through the transporter that permits water to permeate the protein. Trajectories in which spontaneous release of galactose is observed, as well as those in which galactose remains in the binding site, show that the permeation rate, although modulated by substrate occupancy, is not tightly coupled to substrate release. Using a, to our knowledge, novel channel-detection algorithm, we identify the key residues that control water flow through the transporter and show that solvent gating is regulated by side-chain motions in a small number of residues on the extracellular face. A sequence alignment reveals the presence of two insertion sites in mammalian SGLTs that flank these outer-gate residues. We hypothesize that the absence of these sites in vSGLT may account for the high water permeability values for vSGLT determined via simulation compared to the lower experimental estimates for mammalian SGLT1.


Figures

Figure 1
Figure 1
Instantaneous water flow and the identification of water channels. (A and B) Total number of independent water pathways (red) and maximum instantaneous water flow (black) versus time for two representative trajectories. Instantaneous water flux is defined as the number of upward or downward permeation events in 1 ns, and the maximum instantaneous water flux is the larger of these two values. The independent water pathways are the average number of paths identified from the lower bulk to the upper bulk averaged over 1 ns. The red and black curves show marginal agreement, but there are noticeable exceptions, for instance at 375 ns in B, where there are many paths through the transporter even though the water flux is low. The black arrow in B indicates the time from which the snapshot in C is taken. (C) Visualization of the water pathways when the instantaneous water flow and the total pathways are poorly correlated. The snapshot corresponds to the time indicated in B (black arrow). In the snapshot at left, vSGLT is white, and the molecular surface representation of the water is light blue. Two pathways are present: the main channel (red) and a secondary channel (green). Additional analysis revealed that water movement through the secondary channel is slow, and that the primary channel is responsible for the majority of the water flux. At right, the water surface is pictured alone to show clearly the trajectories of the two independent and contiguous pathways. (DF) Removal of secondary-channel data results in excellent correlation between pathway numbers (red) and maximum instantaneous water flow (black). Pathways that ran through the secondary site (Cgreen path) were systematically removed, resulting in marked improvement in the correlations shown in A and B, as can be seen in D and E, respectively. Simulations represented in DF show an increasing degree of channel openness, as well as an increasing degree of water flux. (G–I) Snapshots with zero (G), one (H), and three (I) independent pathways corresponding to the plots in DF, respectively. The color scheme is as in C. In each snapshot, the oxygen atoms from independent pathways are represented by different colors. To see this figure in color, go online.
Figure 2
Figure 2
Identification of residues that control the number of water pathways. (A) Probability of a protein residue or galactose being identified in a gap region. Probability is calculated as the number of total observations divided by the total frames involving water gaps. The x axis is the protein residue number in vSGLT with galactose (1–547), with the galactose being the final value. The dashed line corresponds to a 5% (0.05) probability. (BD) All residues observed in >5% of gaps were highlighted (red) on the vSGLT structure (white) in high water flux (B) and in two low-water-flux states (C and D). Galactose is yellow. Each structure is shown from the extracellular space (upper) and from the membrane (lower). In B, the residues form an annulus with an open center. The side view shows that all residues are localized to the extracellular side of the transporter. In C, the residues form an open annulus, but with the sugar plugging the hole, which explains why no water pathways are found in this snapshot. The asterisks indicate the positions of the insertion sites described in Fig 4 and the Discussion. In D, it can be seen that the outer residues all come together to occlude the outer gate and prevent water pathways through the channel. All of the molecular images were rendered using VMD (61). To see this figure in color, go online.
Figure 3
Figure 3
Water flow and movement of galactose as a function of time. (AI) For each trajectory, the cumulative net flow of water (blue-shaded areas), defined as the difference between cumulative efflux and influx through the transporter, is shown alongside the position of the galactose relative to the sugar binding site projected onto the z axis (black). Net efflux through the transporter corresponds to positive values, whereas net influx results in negative values. Panels A-G show examples of simulations in which galactose was released into the bulk intracellular solution. In panels H and I, the sugar is stable in the binding site for the entire simulation. To see this figure in color, go online.
Figure 4
Figure 4
Insertion sites in mammalian transporters near the extracellular gate. Alignment of the primary sequences of vSGLT, PutP, hSGLT1, and hSGLT2 showing the regions around the two insertion sites found in mammalian transporters, which are absent in the bacterial homologs. Secondary-structure elements are shown above the sequences based on the structure of vSGLT. Strictly conserved and highly conserved residues are shown in red and blue, respectively. Insertion sites 1 (A) and 2 (B) are shown as gray boxes. To see this figure in color, go online.

Comment in

References

    1. Abramson J., Wright E.M. Structure and function of Na+-symporters with inverted repeats. Curr. Opin. Struct. Biol. 2009;19:425–432. - PMC - PubMed
    1. Wright E.M., Loo D.D.F., Hirayama B.A. Biology of human sodium glucose transporters. Physiol. Rev. 2011;91:733–794. - PubMed
    1. Loike J.D., Hickman S., Fischbarg J. Sodium-glucose cotransporters display sodium- and phlorizin-dependent water permeability. Am. J. Physiol. 1996;271:C1774–C1779. - PubMed
    1. Loo D.D., Zeuthen T., Wright E.M. Cotransport of water by the Na+/glucose cotransporter. Proc. Natl. Acad. Sci. USA. 1996;93:13367–13370. - PMC - PubMed
    1. Duquette P.-P., Bissonnette P., Lapointe J.-Y. Local osmotic gradients drive the water flux associated with Na+/glucose cotransport. Proc. Natl. Acad. Sci. USA. 2001;98:3796–3801. - PMC - PubMed

Publication types

Substances