. 2014 Mar 18;106(6):1371-80.
doi: 10.1016/j.bpj.2014.02.005.

Probing the U-shaped conformation of caveolin-1 in a bilayer

Affiliations

Probing the U-shaped conformation of caveolin-1 in a bilayer

Huan Rui et al. Biophys J. .

Abstract

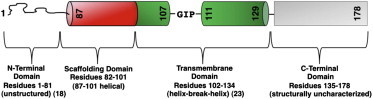
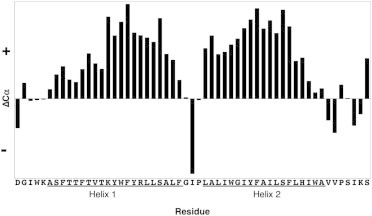
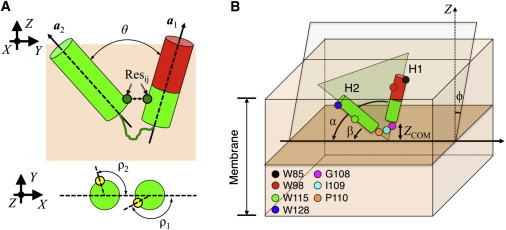
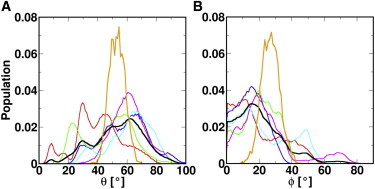
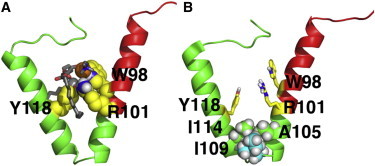
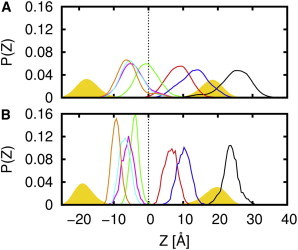
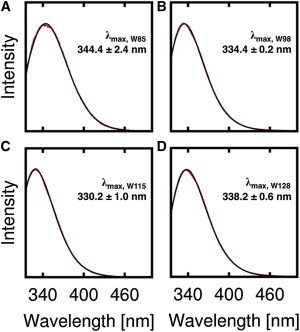
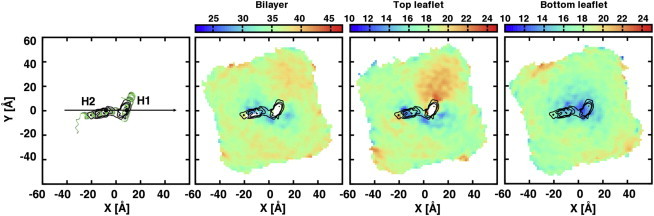
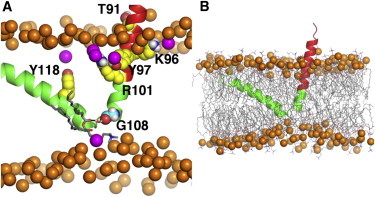
Caveolin induces membrane curvature and drives the formation of caveolae that participate in many crucial cell functions such as endocytosis. The central portion of caveolin-1 contains two helices (H1 and H2) connected by a three-residue break with both N- and C-termini exposed to the cytoplasm. Although a U-shaped configuration is assumed based on its inaccessibility by extracellular matrix probes, caveolin structure in a bilayer remains elusive. This work aims to characterize the structure and dynamics of caveolin-1 (D82-S136; Cav182-136) in a DMPC bilayer using NMR, fluorescence emission measurements, and molecular dynamics simulations. The secondary structure of Cav182-136 from NMR chemical shift indexing analysis serves as a guideline for generating initial structural models. Fifty independent molecular dynamics simulations (100 ns each) are performed to identify its favorable conformation and orientation in the bilayer. A representative configuration was chosen from these multiple simulations and simulated for 1 μs to further explore its stability and dynamics. The results of these simulations mirror those from the tryptophan fluorescence measurements (i.e., Cav182-136 insertion depth in the bilayer), corroborate that Cav182-136 inserts in the membrane with U-shaped conformations, and show that the angle between H1 and H2 ranges from 35 to 69°, and the tilt angle of Cav182-136 is 27 ± 6°. The simulations also reveal that specific faces of H1 and H2 prefer to interact with each other and with lipid molecules, and these interactions stabilize the U-shaped conformation.


Figures

Figure 1
Figure 1
Proposed domains of caveolin-1. To see this figure in color, go online.
Figure 2
Figure 2
Chemical shift index plot of Cav182–136. Positive ΔCα values are indicative of α-helical structure (24). Helix 1 (H1) spans residues A87–F107 and Helix 2 (H2) spans residues L111–A129. The two helices are separated by a three-residue break (G108–P110).
Figure 3
Figure 3
(A) Degrees of freedom used to define the conformation of Cav182–136. They include θ, ρ1, ρ2, and the contacting residues pairs (Resij). Reference atoms (Cα of T91 on H1 and Cα of W115 on H2) employed in ρ1 and ρ2 calculation are shown as yellow spheres. (B) Degrees of freedom (ϕα, β, and ZCOM) describing the topological orientation of caveolin-1 with respect to a membrane bilayer. The membrane is centered at Z = 0. Residues of interest are indicated by colored spheres. CSD domain (D82–R101) is shown as a red cylinder. To see this figure in color, go online.
Figure 4
Figure 4
The population distributions of (A) θ and (B) ϕ in all the systems. Different sets of simulations are distinguished by colors: cav1_45 (red); cav1_55 (green); cav1_65 (blue); cav1_75 (magenta); cav1_85 (cyan); and 1-μs simulation results (orange). Averaged distributions from all the 100-ns systems are shown in black. To see this figure in color, go online.
Figure 5
Figure 5
(A) Lipid packing around Cav182–136 and (B) residues forming the H1-H2 interface. The protein is shown as a cartoon representation (green) with the CSD domain (red). Residues that are facing each other and participate in protein-lipid interactions are shown in yellow. Lipid molecule in the space between the H1 and H2 helices are shown in grey. Phosphate atoms are shown as orange spheres. The contacting residues are A105, I109, and I114. The two β-carbon branches of I109 participate in forming the interface. Both snapshots were taken from the 1-μs simulation. To see this figure in color, go online.
Figure 6
Figure 6
The ZCOM distributions for W85 (black), W98 (red), W115 (green), and W128 (blue), and the break residues G108 (magenta), I109 (cyan), and P110 (orange) in (A) the multiple Cav182–136 systems and (B) the 1-μs simulation. The histograms in panel A are averaged over all 50 multiple simulations. The bilayer center is indicated by dashed black lines. Distribution of lipid phosphate atoms is shown by yellow filled regions. An illustration of the approximate relative positions of these residues on Cav182–136 can be found in Fig. 3B. To see this figure in color, go online.
Figure 7
Figure 7
Fluorescence emission spectra of Cav182–136 (A) W85, (B) W98, (C) W115, and (D) W128 in 4.0% (w/w) DMPC/CHAPSO q = 0.5 bicelles; 20 mM phosphate, pH 7.0. To see this figure in color, go online.
Figure 8
Figure 8
The membrane thickness profiles. Before making the profiles, the caveolin-1 molecules are aligned so that the vector connecting the centers of H2 and H1 coincides with the X axis (H2 on the left). The following plots are the thickness profiles of the bilayer, the top leaflet, and the bottom leaflet, respectively. Results from system cav1_65_3 are shown. To calculate the profile, a two-dimensional grid is placed on the XY plane on top of the protein. For each grid point, the averaged Z positions of the phosphate atoms at the top and bottom leaflets are computed. These Z values represent the thickness of the top and bottom leaflets, respectively. The difference indicates the entire bilayer thickness. (Color scale in the plots goes from blue to red with increasing thickness.) Grid points with no phosphate atom present are excluded from the thickness calculations (black contour lines). Density of the protein is plotted on the XY plane to show the regions of caveolin-1 that are responsible for membrane perturbation. To see this figure in color, go online.
Figure 9
Figure 9
(A) Electrostatic and hydrogen-bonding interactions between caveolin-1 and surrounding lipids. (B) Membrane thinning induced by Cav182–136 insertion. Both snapshots are taken from system cav1_65_3. Cav182–136 is shown in cartoon representation; CSD domain (red). Phosphate atoms in the bulk bilayer are shown as orange spheres and phosphate atoms that are within 4.5 Å to the protein are shown in magenta. The polar and charged residues from the CSD domain (T91, K96, Y97, and R101 shown in yellow) form interactions with the lipids in the top leaflet. A water-bridged hydrogen bond between the backbone atoms of G108 (cyan spheres) and a lipid headgroup in the bottom leaflet is also shown. To see this figure in color, go online.

References

    1. Parton R.G., Simons K. The multiple faces of caveolae. Nat. Rev. Mol. Cell Biol. 2007;8:185–194. - PubMed
    1. Anderson R.G. The caveolae membrane system. Annu. Rev. Biochem. 1998;67:199–225. - PubMed
    1. Parton R.G., del Pozo M.A. Caveolae as plasma membrane sensors, protectors and organizers. Nat. Rev. Mol. Cell Biol. 2013;14:98–112. - PubMed
    1. Krajewska W.M., Masłowska I. Caveolins: structure and function in signal transduction. Cell. Mol. Biol. Lett. 2004;9:195–220. - PubMed
    1. Williams T.M., Lisanti M.P. The caveolin genes: from cell biology to medicine. Ann. Med. 2004;36:584–595. - PubMed

Publication types

MeSH terms

LinkOut - more resources