. 2014 Mar 21;7(1):41.
doi: 10.1186/1754-6834-7-41.

Comparative metabolism of cellulose, sophorose and glucose in Trichoderma reesei using high-throughput genomic and proteomic analyses

Affiliations

Comparative metabolism of cellulose, sophorose and glucose in Trichoderma reesei using high-throughput genomic and proteomic analyses

Lilian Dos Santos Castro et al. Biotechnol Biofuels. .

Abstract

Background: The filamentous fungus Trichoderma reesei is a major producer of lignocellulolytic enzymes utilized by bioethanol industries. However, to achieve low cost second generation bioethanol production on an industrial scale an efficient mix of hydrolytic enzymes is required for the deconstruction of plant biomass. In this study, we investigated the molecular basis for lignocellulose-degrading enzyme production T. reesei during growth in cellulose, sophorose, and glucose.

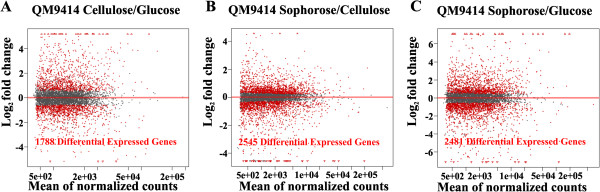
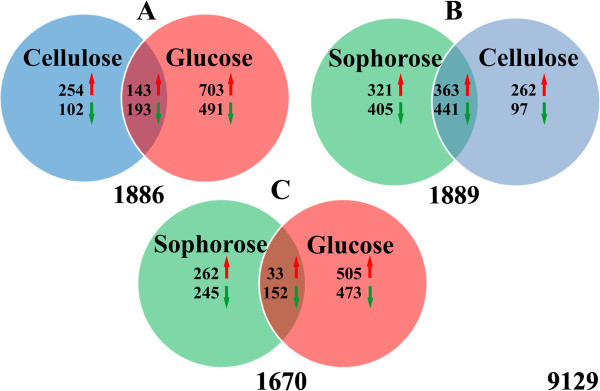
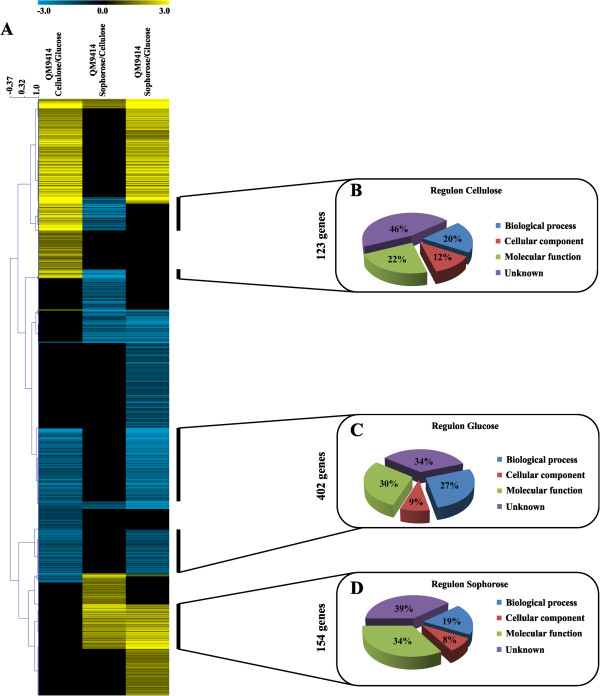
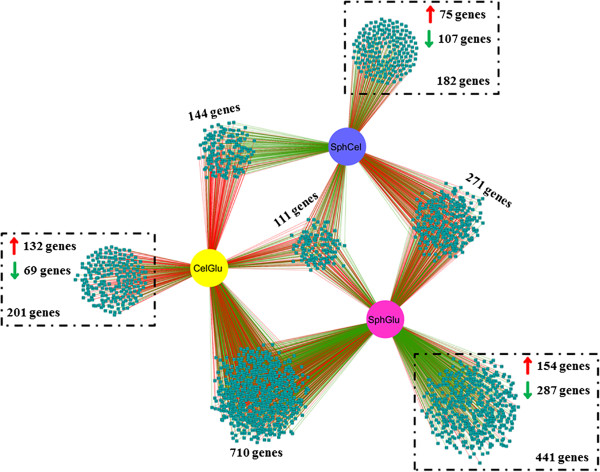
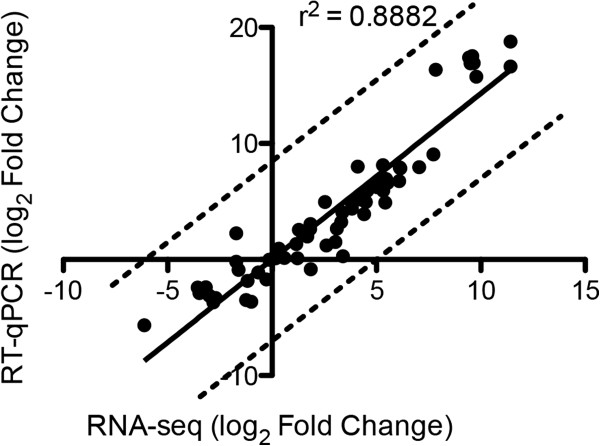
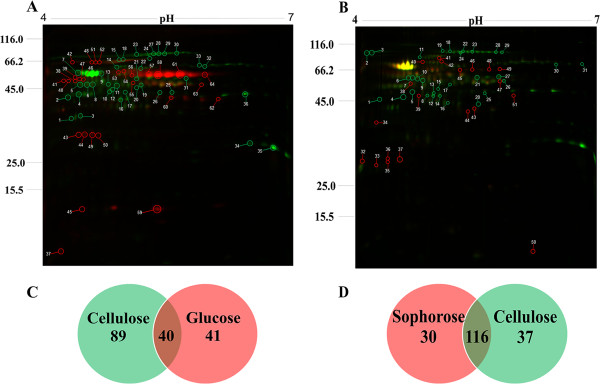
Results: We examined and compared the transcriptome and differential secretome (2D-DIGE) of T. reesei grown in cellulose, sophorose, or glucose as the sole carbon sources. By applying a stringent cut-off threshold 2,060 genes were identified as being differentially expressed in at least one of the respective carbon source comparisons. Hierarchical clustering of the differentially expressed genes identified three possible regulons, representing 123 genes controlled by cellulose, 154 genes controlled by sophorose and 402 genes controlled by glucose. Gene regulatory network analyses of the 692 genes differentially expressed between cellulose and sophorose, identified only 75 and 107 genes as being specific to growth in sophorose and cellulose, respectively. 2D-DIGE analyses identified 30 proteins exclusive to sophorose and 37 exclusive to cellulose. A correlation of 70.17% was obtained between transcription and secreted protein profiles.

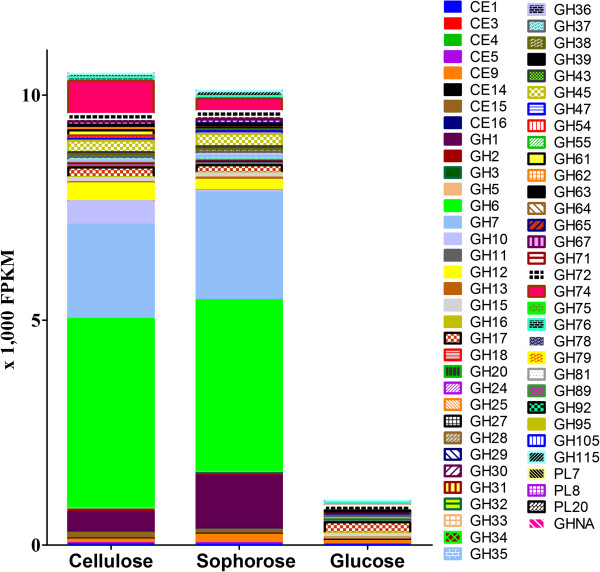
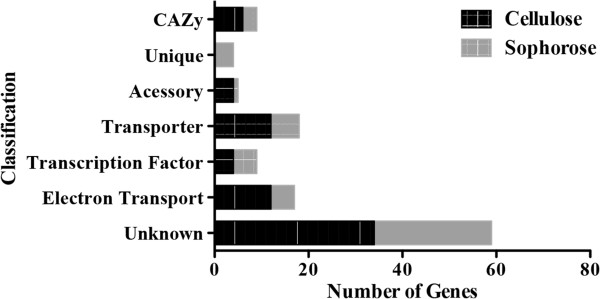
Conclusions: Our data revealed new players in cellulose degradation such as accessory proteins with non-catalytic functions secreted in different carbon sources, transporters, transcription factors, and CAZymes, that specifically respond in response to either cellulose or sophorose.


Figures

Figure 1
Figure 1
Comparison of full-genome expression profiles of QM9414 strain grown in cellulose, sophorose, and glucose as the carbon source, measured by RNA-seq. (A) Cellulose/glucose. (B) Cellulose/sophorose. (C) Sophorose/glucose. Differentially expressed genes identified by DESeq package are plotted in red (P <0.05).
Figure 2
Figure 2
Venn diagram representing the number of differentially expressed genes in the QM9414 strain. (A) QM9414 strain growth in cellulose and glucose as carbon source. (B) QM9414 strain growth in cellulose and sophorose. (C) QM9414 strain growth in sophorose and glucose. The red arrows indicate the number of upregulated genes and green arrows the number of downregulated genes in the conditions analyzed. The numbers below the given Venn diagram represent the total number of regulated genes. The number in the lower right of rectangle indicates the number of transcripts in the T. reesei genome. Thresholds for calling differentially expressed genes were (P ≤0.05) and ≥ two-fold change, that is, log2-fold change ≥1 or ≤ -1.
Figure 3
Figure 3
Gene expression profile of T. reesei, QM9414 strain, during grown in the presence of cellulose, sophorose and glucose as the carbon source. Expression scale is represented as Log2 Fold Change. (A) Hierarchical clustering analysis was performed using Mev v.4.6.1, with the average linkage method for cluster generation, and uncentered correlation as the similarity metric. Euclidian distance was used to measure the differences in gene expression among the 2,060 genes and the groups (QM9414 Cellulose/Glucose; QM9414 Sophorose/Cellulose and QM9414 Sophorose/Glucose) based on the distance between the centroids of the groups, P <0.05. (B) Genes upregulated by cellulose, (C) genes upregulated by glucose and (D) genes upregulated by sophorose. In (B), (C) and (D) the summary of the Gene Ontology annotation are also represented.
Figure 4
Figure 4
Carbohydrate active enZymes (CAZy) genes and expression data from RNA-seq analysis. Fragments per kilobase of exon per million fragments mapped (FPKM) means for each glycolic hydrase (GH) family when cultured in glucose, cellulose and sophorose. CAZy classification was performed based on re-annotation of CAZy genes of T. reesei according to Hakkinen et al. [9].
Figure 5
Figure 5
Gene regulatory network (GRN) of 2,060 differentially expressed genes in T. reesei QM9414 in each tested condition. Cellulose versus glucose (CelGlu), sophorose versus cellulose (SphCel) and sophorose versus glucose (SphGlu). Genes are represented as nodes (shown as squares), and interactions are represented as edges (shown as lines, that is, red indicates upregulated interactions and green indicates downregulated interactions), that connect the nodes: 3,385 interactions.
Figure 6
Figure 6
Gene Ontology (GO) enrichment analysis of different classes of genes upregulated in cellulose and sophorose in T. reseei. Significantly enriched categories (P ≤0.05) are shown. The complete list of differentially expressed genes is shown in Additional file 7: Table S7.
Figure 7
Figure 7
Correlation between RNAseq and quantitative real-time PCR (RT-qPCR). Comparison of log2 fold change of 20 genes obtained by RNA-seq and RT-qPCR. Real-time PCR was performed using the amplified cDNA from each RNA-seq sample. Strong, statistically significant Pearson correlation is shown between the expression levels measured using real-time PCR and RNA-seq.
Figure 8
Figure 8
Differential gel electrophoresis (DIGE) analysis of T. reesei secretome grown in different carbon sources. (A) DIGE of cellulose (green spots) versus glucose (red spots). (B) DIGE of cellulose (green spots) versus sophorose (red spots). (C) Venn diagram from analysis of cellulose versus glucose. (D) Venn diagram from analysis of cellulose versus sophorose. The numbers in white indicate the spots subjected to liquid chromatography tandem mass spectrometry analysis. Protein IDs of identified spots are listed in Additional files 9 and 10: Table S.9.1 and S9.2).

References

    1. Pessoa-Jr A, Roberto IC, Menossi M, dos Santos RR, Filho SO, Penna TC. Perspectives on bioenergy and biotechnology in Brazil. Appl Biochem Biotechnol. 2005;121–124:59–70. - PubMed
    1. Mosier N, Wyman C, Dale B, Elander R, Lee YY, Holtzapple M, Ladisch M. Features of promising technologies for pretreatment of lignocellulosic biomass. Bioresour Technol. 2005;96:673–686. doi: 10.1016/j.biortech.2004.06.025. - DOI - PubMed
    1. Ojeda K, Kafarov V. Exergy analysis of enzymatic hydrolysis reactors for transformation of lignocellulosic biomass to bioethanol. Chem Eng J. 2009;154:390–395. doi: 10.1016/j.cej.2009.05.032. - DOI
    1. Soccol CR, Vandenberghe LPD, Medeiros ABP, Karp SG, Buckeridge M, Ramos LP, Pitarelo AP, Ferreira-Leitao V, Gottschalk LMF, Ferrara MA, Bon EPD, de Moraes LMP, Araujo JD, Torres FAG. Bioethanol from lignocelluloses: Status and perspectives in Brazil. Bioresource Technology. 2010;101:4820–4825. doi: 10.1016/j.biortech.2009.11.067. - DOI - PubMed
    1. Kubicek CP, Herrera-Estrella A, Seidl-Seiboth V, Martinez DA, Druzhinina IS, Thon M, Zeilinger S, Casas-Flores S, Horwitz BA, Mukherjee PK, Mukherjee M, Kredics L, Alcaraz LD, Aerts A, Antal Z, Atanasova L, Cervantes-Badillo MG, Challacombe J, Chertkov O, McCluskey K, Coulpier F, Deshpande N, von Dohren H, Ebbole DJ, Esquivel-Naranjo EU, Fekete E, Flipphi M, Glaser F, Gomez-Rodriguez EY, Gruber S. et al.Comparative genome sequence analysis underscores mycoparasitism as the ancestral life style of Trichoderma. Genome biology. 2011;12:R40. doi: 10.1186/gb-2011-12-4-r40. - DOI - PMC - PubMed