. 2014 Mar 22;14(1):56.
doi: 10.1186/1471-2148-14-56.

Genotype and diet shape resistance and tolerance across distinct phases of bacterial infection

Affiliations

Genotype and diet shape resistance and tolerance across distinct phases of bacterial infection

Virginia M Howick et al. BMC Evol Biol. .

Abstract

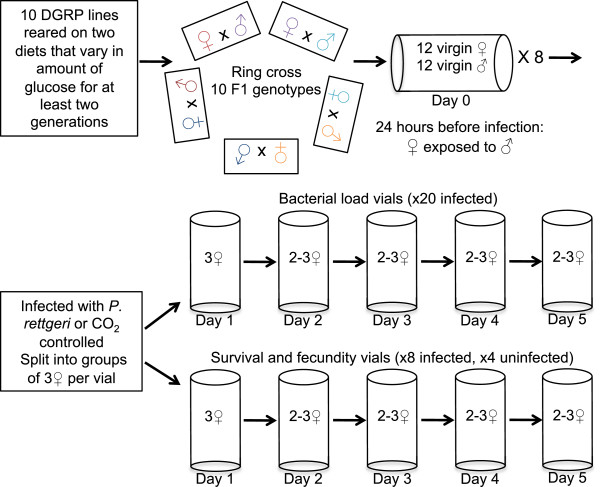
Background: Host defense against pathogenic infection is composed of resistance and tolerance. Resistance is the ability of the host to limit a pathogen burden, whereas tolerance is the ability to limit the deleterious effects of a given pathogen burden. This distinction recognizes that the fittest host does not necessarily have the most aggressive immune system, suggesting that host-pathogen co-evolution involves more than an escalating arms race between pathogen virulence factors and host antimicrobial activity. How a host balances resistance and tolerance and how this balance influences the evolution of host defense remains unanswered. In order to determine how genotype-by-diet interactions and evolutionary costs of each strategy may constrain the evolution of host defense, we measured survival, fecundity, and pathogen burden over five days in ten genotypes of Drosophila melanogaster reared on two diets and infected with the Gram-negative bacterial pathogen Providencia rettgeri.

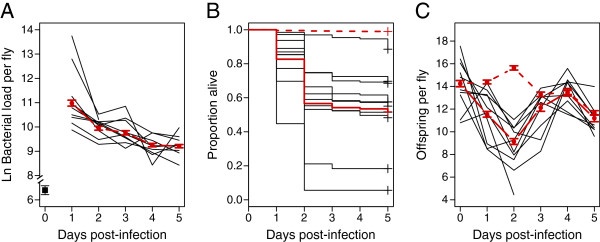
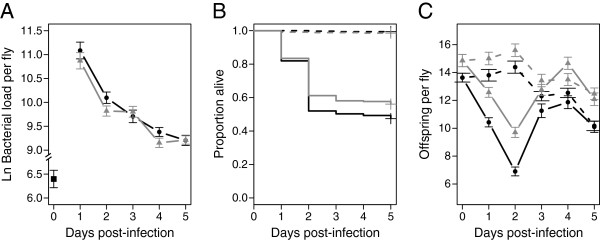
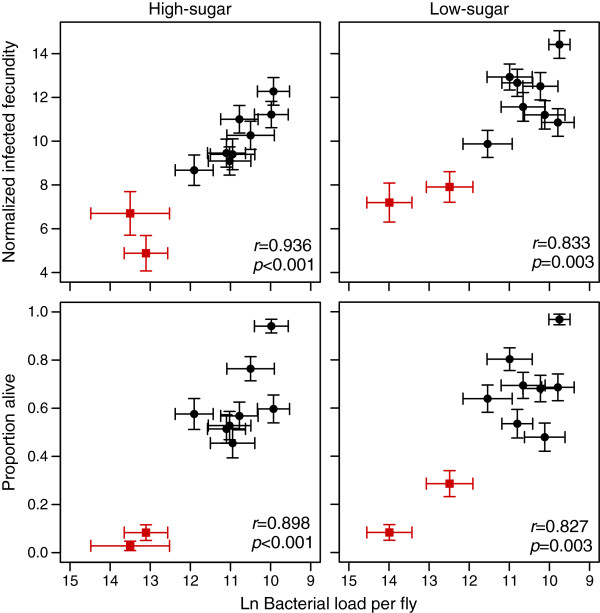
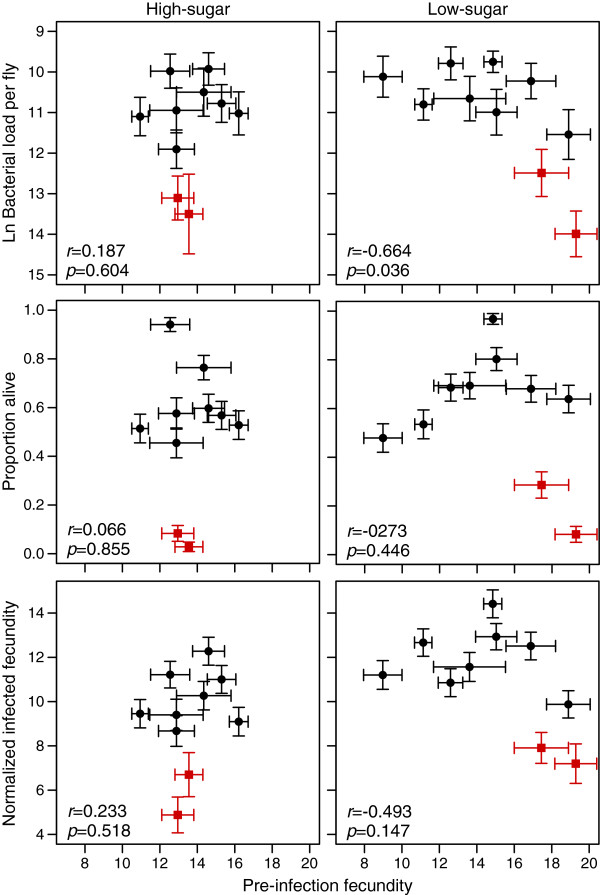
Results: We demonstrated two distinct phases of infection: an acute phase that consists of high mortality, low fecundity, and high pathogen loads, and a chronic phase where there was a substantial but stable pathogen load and mortality and fecundity returned to uninfected levels. We demonstrated genetic variation for resistance in both phases of infection, but found genetic variation for tolerance only in the acute phase. We found genotype-by-diet interactions for tolerance, especially in the acute phase, but genotype-by-diet interaction did not significantly shape resistance. We found a diet-dependent positive relationship between resistance and tolerance and a weak evolutionary cost of resistance, but did not detect any costs of tolerance.

Conclusions: Existing models of tolerance and resistance are overly simplistic. Multi-phase infections such as that studied here are rarely considered, but we show important differences in determination and evolutionary constraints on tolerance and resistance over the two phases of infection. Our observation of genetic variation for tolerance is inconsistent with simple models that predict evolutionary fixation of tolerance alleles, and instead indicate that genetic variation for resistance and tolerance is likely to be maintained by non-independence between resistance and tolerance, condition-dependent evolutionary costs, and environmental heterogeneity.


Figures

Figure 1
Figure 1
Experimental design. Outbred F1 progeny were derived from the ten DGRP lines using a ring crossing design, such that each line contributed a mother for one experimental genotype and a father for another. Virgin F1 females were exposed to males 24 hours prior to infection. Flies were infected with P. rettgeri. After infection flies were split into two groups: those for measuring bacterial load and those for measuring survival and fecundity. All vials were transferred daily and maintained at a density of 2–3 females. Each day a subsample of flies were removed for the destructive bacterial load assay. Daily mortality was recorded for the survival and fecundity vials, and the vials were saved to count the number of eventually emerging adult offspring. All of this was performed on the two diets that differed in the level of glucose.
Figure 2
Figure 2
Natural variation in defense. Bacterial load (A), survival (B), and fecundity (C) over five days post-infection. The solid red line is the overall estimate of each phenotype calculated across all diets and genotypes. The black lines represent each genotype across both diets. The dashed red lines are the overall estimates of uninfected CO2 control flies. The majority of the mortality occurs within the first two days after infection, when bacterial loads are at their highest. We term this the “acute” phase of infection. Bacterial load and survival stabilize after day 3, into the “chronic” phase of infection. The difference in fecundity between infected and uninfected flies occurs during the acute phase, with a mean of 9.14 offspring per infected female and 15.63 offspring per uninfected female in the second day after infection. There is genetic variation for all three phenotypes measured.
Figure 3
Figure 3
Diet affects defense. Bacterial load (A), survival (B), and fecundity (C) over five days post-infection across the two diets that vary in glucose concentration (black: high-sugar, 50 g/L; grey: low-sugar, 25 g/L). The dashed lines represent the uninfected CO2 control flies on each diet. Diet significantly affected all three phenotypes measured.
Figure 4
Figure 4
Diet-dependent positive relationship between resistance and fecundity tolerance. Each plotted data point represents a single genotype (error bars are standard errors). The square, red points represent the genotypes that experienced very high mortality after infection. A positive relationship was found between resistance, plotted as descending bacterial load 24 hours after infection, and normalized infected fecundity, estimated as the least-squares mean from Model A. When the two genotypes that had the highest mortality are excluded, the relationship is only significant on the high-sugar diet, suggesting that that these two traits can be decoupled in a diet-dependent manner. A similar pattern was seen when the proportion of flies surviving three days post-infection was used to estimate tolerance, except that the relationship was not significant on either diet when the high-mortality genotypes were excluded (see main text).
Figure 5
Figure 5
Evolutionary costs of defense. There is a weak diet-dependent evolutionary cost of resistance plotted as descending bacterial load 24 hours after infection and pre-infection fecundity. Pre-infection fecundity was estimated as the number of offspring per female produced during the 24 hours prior to infection. This relationship is dependent on the two high morality genotypes. Similar patterns are seen for the relationship between pre-infection fecundity and normalized infected fecundity as well as survival across both diets, but these were not significant.

References

    1. Ayres JS, Schneider DS. Tolerance of infections. Annu Rev Immunol. 2012;30:271–294. doi: 10.1146/annurev-immunol-020711-075030. - DOI - PubMed
    1. Boots M, Bowers RG. Three mechanisms of host resistance to microparasites-avoidance, recovery and tolerance-show different evolutionary dynamics. J Theor Biol. 1999;201:13–23. doi: 10.1006/jtbi.1999.1009. - DOI - PubMed
    1. Roy BA, Kirchner JW. Evolutionary dynamics of pathogen resistance and tolerance. Evolution. 2000;54:51–63. - PubMed
    1. Miller MR, White A, Boots M. The evolution of parasites in response to tolerance in their hosts: the good, the bad, and apparent commensalism. Evolution. 2006;60:945. - PubMed
    1. Stahl EA, Dwyer G, Mauricio R, Kreitman M, Bergelson J. Dynamics of disease resistance polymorphism at the Rpm1 locus of Arabidopsis. Nature. 1999;400:667–671. doi: 10.1038/23260. - DOI - PubMed

Publication types

LinkOut - more resources