Review
. 2014 Apr:241:3-17.
doi: 10.1016/j.jmr.2014.01.008.

Chemical exchange in biomacromolecules: past, present, and future

Affiliations
Review

Chemical exchange in biomacromolecules: past, present, and future

Arthur G Palmer 3rd. J Magn Reson. 2014 Apr.

Abstract

The perspective reviews quantitative investigations of chemical exchange phenomena in proteins and other biological macromolecules using NMR spectroscopy, particularly relaxation dispersion methods. The emphasis is on techniques and applications that quantify the populations, interconversion kinetics, and structural features of sparsely populated conformational states in equilibrium with a highly populated ground state. Applications to folding, molecular recognition, catalysis, and allostery by proteins and nucleic acids are highlighted.

Keywords: Dynamics; Kinetics; NMR; Nucleic acids; Proteins; Relaxation.


Figures

Fig. 1
Fig. 1
Pulse sequence diagrams for (a) in-phase HSQC-detected [27] and (b) 15N TROSY-selected [31] ZZ-exchange experiments; the sequence in (a) is suitable for 13C or 15N spins (although water flip-back water suppression could be added in the case of 15N spins in similar fashion as in (b)). Narrow and wide bars represent 90° and 180° pulses, respectively; short narrow open bars represent water-selective 90° pulses; and wide open bars represent crafted 180° pulses that leave the water magnetization unperturbed [1]. All pulse phases are x unless indicated otherwise. The delays are Δ = 1/(4JXH) and τ = 1/(8JXH). Gradients are used to suppress unwanted coherences and pulse imperfections. (a) Decoupling during the relaxation delay uses a train of 1H 180° pulses. Decoupling during acquisition is achieved with the GARP sequence [161]. The phase cycle is ϕ1 = x, −x; ϕ2 = x,x,y,y,−x,−x,−y,−y; and receiver = x,−x,−x,x. Frequency discrimination is obtained by shifting the phase of the receiver and ϕ1 according to the States-TPPI protocol [162]. (b) The phase cycle is ϕ1 = 4(x,−x,−y,y), ϕ2 = 2(135°,315°,45°,225°), 2(315°,135°,225°,45°), ϕ3 = 4(x,−x,−y,y), ϕ4 = 4(x,−x,y,−y), ϕ5 - 5 = 2(y,y,y,y,−y,−y,−y,−y), ϕ6 = 2(−y,−y,−y,−y,y,y,y,y), ϕ7 = 4(−x,x,−y,y), ϕ8 = 2(x,x,x,x,−x,−x,−x,−x), ϕrec = (x,−x,y,−y,x,−x,−y,y,−x,x,−y,y,−x,x,y,−y). Frequency discrimination is obtained by shifting the phase of the receiver and ϕ4 according to the States-TPPI protocol [162].
Fig. 2
Fig. 2
ZZ-exchange characterization of a monomer–dimer equilibrium for E-cadherin domains 1 and 2. (a) Composite peak intensity ratio Π(T) for 15N ZZ-exchange measurements for residues Ile38 and Asp90 of a protein construct consisting of wild-type mouse E-cadherin extracellular domains 1 and 2 (EC1–EC2). The inset shows 15N ZZ-exchange spectra of residue Ile38 at several mixing times. The solid lines are best-fits to the experimental data to a modification of Eq. (5) for a monomer–dimer equilibrium, yielding k12 = kon = (1.0 ± 0.1) × 104 M−1 s−1 and k21 = koff = 0.8 ± 0.1 s−1 at 299 K. (b) Crystal structure of E-cadherin EC1–EC2 domains (Protein Data Bank (PDB) ID code 2qvf) showing the strand-swapped dimer interface of wild type protein. Reprinted from Y. Li, N. Altorelli, F. Bahna, B. Honig, L. Shapiro, A.G. Palmer, Mechanism of E-cadherin dimerization probed by NMR relaxation dispersion, Proc. Natl. Acad. Sci. USA. 110 (2013) 16462–16467.
Fig. 3
Fig. 3
ZZ-exchange spectra for DMTCA aligned in poly-γ-benzyl-l-glutamate (PBLG) using a mixing time of 75 ms and T = 281.3 K. Auto-peaks are shown in red and blue boxes for the two methyl 13C spins in DMTCA; cross peak patterns are indicated by dotted lines. (a) Coupled ZZ-exchange experiment in which cross peaks develop between individual multiplet component pairs reflecting both conformational differences in chemical shifts and RDCs. (b) Conventional 1H decoupled ZZ-exchange experiment reflecting only differences in chemical shifts. (c) The case in which Δω = 0 is simulated by adding 180° 1H and 13C pulses in the midpoint of the t1 frequency labeling delay. (d) Expansion of the boxed region in (c) shows that cross peaks are observed owing to difference in RDCs for the two exchanging methyl groups even in the absence of chemical shift differences.
Fig. 4
Fig. 4
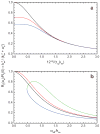
Normalized relaxation dispersion for (a) CPMG and (b) R1ρ experiments. Calculations were performed for a minor site population of p2 = 0.05. In (a), the black curve shows the dispersion profile obtained in fast exchange (Δω/kex = 0.28) and is independent of scaling of Δω for different static magnetic fields (and thus, as shown by Eq. (7), the full dispersion curve scales quadratically with the applied static magnetic field). The green and red curves show the profiles obtained for slow exchange; the static magnetic field for the green curve (Δω/kex = 3.7) is 1.33 times larger than for the red curve (Δω/kex = 2.8), as would be obtained using 600 and 800 MHz NMR spectrometers. The reduced dispersion amplitude for the green curve results, again using Eq. (7), with a full dispersion curve that scales less than quadratically with the applied static magnetic field. In (b), ω1/2π = 150 Hz, and Δω = 3 ppm, assuming a static magnetic field strength of 14.1 T (600 MHz). The green and blue curves show results for kex = 2000 s−1 in which the resonance offset from the population-averaged position is shifted (green) in the direction of the minor state resonance or (blue) away from the minor state resonance. The maximum in the green curve occurs when the spin-lock rf field is on-resonance with peak position in the minor chemical state. The red and black curves show that when kex = 20,000 s−1 is increased towards the fast-exchange limit, the differences in (red, towards minor resonance) and (black, away from minor resonance) sweep directions is reduced.
Fig. 5
Fig. 5
Pulse sequences for (a) TROSY-detected [82] and (b) TROSY-selected [83] R1ρ experiments. Narrow and wide bars depict 90° and 180° pulses, respectively; short narrow open bars represent water-selective 90° pulses; and wide open bars represent crafted 180° pulses that leave the water magnetization unperturbed [1]. Composite pulses are 90x°210y°90x°, shown as three closely spaced bars. All pulses are x-phase unless otherwise indicated. The delays are Δ = 1/(4JNH), τ = 1/(8JNH), Ξ > Ge, ε = Δζ/2, ζ > Gd. The spin-lock fields are shown as open rectangles; the triangular segments are adiabatic pulse schemes to rotate the magnetization from (to) the z-axis to (from) the orientation of the effective field in the rotating frame [163]. Phase cycles are (a) ϕ1 = 4y, 4(−y); ϕ2 = y,x,−y,−x; ϕ3 = y; and receiver phase = y,−x,−y,x,−y,x,y,−x and (b) ϕ1 = x,−x; ϕ2 = x,x,−x,−x; ϕ3 = y; ϕ4 = x; ϕ5 = 4(135°) 4(315°); and receiver = (x,−x,−x,x,−x,x,x,−x). Gradients Ge and Gd are used for coherence selection; other gradients are for artifact suppression. Gradients are rectangular or shaped as indicated (for details see the original publications). Echo/antiecho quadrature detection [164] is achieved by (a) inverting ϕ3, and the sign of gradient Ge and using ϕ2 = y,−x,−y,x; and (b) inverting ϕ3, ϕ4, and the sign of gradient Ge. The ϕ1 and receiver phases are inverted for each t1 increment to shift axial peaks to the edge of the spectrum.
Fig. 6
Fig. 6
15N R1ρ relaxation dispersion for ubiquitin. Relaxation dispersion curves for two exchange-broadened residues in ubiquitin, (circles) Asn 25 and (squares) Ile 23, collected using (blue) TROSY-detected or (red) TROSY-selected R1ρ experiments. Solid lines represent the fits to the experimental data obtained using the chemical exchange parameters of Massi et al. [86] and R20 or R2β,0 as an adjustable parameter. The R2β,0 values obtained in the TROSY-selected R1ρ experiment are 5.27 ± 0.05 s−1 and 5.62 ± 0.07 s−1 for Ile 23 and Asn 25, as compared to the R20 values of 10.8 ± 0.1 s−1 and 10.6 ± 0.1 s−1 obtained in the TROSY-detected R1ρ experiment. Representative TROSY-selected R1ρ relaxation dispersion curve for one of the non-exchanging residues, Thr 66, is shown with triangles. Reprinted with permission from T.I. Igumenova, A.G. Palmer, Off-resonance TROSY-selected R1ρ experiment with improved sensitivity for medium- and high-molecular-weight proteins, J. Am. Chem. Soc. 128 (2006) 8110–8111. Copyright 2006 American Chemical Society.
Fig. 7
Fig. 7
1HN CPMG relaxation dispersion data for mouse E-cadherin extracellular domains 1 and 2. (a) Dispersion profiles for the monomer resonances of (a) Ile 7 and (b) Gln 101 for two different total monomer protein concentrations of (red, blue) 374 μM and (purple) 97 μM recorded at (red, purple) 600 and (blue) 800 MHz 1H frequencies. The solid lines are fits to the data, yielding kex = 1890 ± 130 s−1 and p2 = 0.025 ± 0.003 at the higher concentration at the lower concentration, p2 = 0.017 ± 0.003. (c) X-dimer interface (drawn from the X-ray crystal structure of the E89A mutant, PDB ID code 3lni) with residues showing relaxation dispersion highlighted as stick representations. The green spheres represent bound calcium ions. Reprinted from Y. Li, N. Altorelli, F. Bahna, B. Honig, L. Shapiro, A.G. Palmer, Mechanism of E-cadherin dimerization probed by NMR relaxation dispersion, Proc. Natl. Acad. Sci. USA 110 (2013) 16462–16467.
Fig. 8
Fig. 8
Relaxation measurements for methyl groups. (a) 1H R1ρ pulse sequence for 13CHD2 groups [17] and (b) ZQ-TROSY Hahn-echo pulse sequence for 13CH3 groups [70]. Narrow and wide bars depict 90° and 180° pulses respectively; wide open bars represent crafted 180° pulses that leave the water magnetization unperturbed [1]. All pulses are x-phase unless otherwise indicated. Decoupling during acquisition uses WALTZ-16 [165]. (a) The delays are τa = 1.67 ms and τb = 2.0 ms. For constant time evolution, Tc = 14.3 ms, Δ1 = τb + t1/2, Δ2 = Tcτb, and Δ3 = Tct1/2. For isolated 13CHD2 methyl groups, non-constant time evolution uses Δ1 = τb + t1/2, Δ2 = t1/2, and Δ3 = τb. The spin-lock fields are shown as open rectangles; the triangular segments are adiabatic pulse schemes to rotate the magnetization from (to) the z-axis to (from) the orientation of the effective field in the rotating frame [163]. Phase cycles are ϕ1 = x,−x; ϕ2 = x,x,y,y,−x,−x,−y,−y; and receiver phase = x,−x,−x,y,−y. Gradients are for artifact suppression. Frequency discrimination is obtained by shifting the phase of the receiver and ϕ1 according to the States-TPPI protocol [162]. (b) The delay τ = 1/(2JCH) ≈ 3.91 ms. Phase cycles are ϕ1 = x,−x; and receiver phase = x,−x. Gradients GX and GSQ are used for coherence selection; other gradients are for artifact suppression. For recording ZQ relaxation, ϕ1 = x. Multiplet filtration is obtained by adding data sets recorded with (i) Δ1 = 0, Δ2 = T/2 + τ/4 + t1, Δ3 = 0 and Δ4 = T/2 + τ/4 and (ii) Δ1 = τ/4, Δ2 = T/2 + t1, Δ3 = τ/4 and Δ4 = T/2. The corresponding data sets for echo/antiecho quadrature detection use (iii) Δ1 = 0, Δ2 = T/2 + τ/4, Δ3 = 0 and Δ4 = T/2 + τ/4 + t1 and (iv) Δ1 = T/2, Δ2 = τ/4, Δ3 = T/2 + t1 and Δ4 = τ/4. Gradient GX = GZQ for data sets (i–iii) and GDQ for data set (iv). The ϕ1 and receiver phases are inverted for each t1 increment to shift axial peaks to the edge of the spectrum. Corresponding values of parameters for measuring DQ relaxation rate constants are given in the original publication.
Fig. 9
Fig. 9
Relaxation dispersion characterization of a folding intermediate for the villin headpiece domain HP67. (a) Backbone 13Cα CPMG relaxation dispersion profiles for Arg 37 measured at a static magnetic field strength of 14.1 T. The solid lines are fits to the data. The dashed line corresponds to the value of R20 used to constrain the data in the limit of infinitely fast pulsing. (b) The corresponding Hahn-echo R2 dispersion data are plotted versus ωc2 in the inset; the solid line is a linear fit to the data; the y-intercept determines R20. Methyl 13C CPMG relaxation dispersion profiles measured at static magnetic field strengths of (○) 14.1 T and (●) 18.8 T for (c) Val20 Cγ2 and (d) Val33 Cγ2. The solid lines are fits to the data. (e) Analysis of ϕex = p1pω2 for 13Cα and methyl 13C spins in HP67. Values determined from individual fits of Rex and the global value of kex = 3190 ± 180 s−1 are plotted versus |Ωsec| for (a) 13Cα (●,○) and (b) methyl 13C (■,□) spins. Green symbols represent data for residues that are assumed to be fully unfolded in the intermediate ensemble; the dashed green line yields a slope of 0.104 ± 0.005, corresponding to a population of (1.09 ± 0.11)% for the intermediate state. The solid line has a slope of 0.0105, corresponding to p2 = (1.11 ± 0.09)% observed previously for 15N spin relaxation dispersion [101]. Data points that were excluded from the fit are grouped into two categories: (i) those that lie above and to the left of the fitted line adopt non-native conformations in the intermediate and (ii) those that lie below and to the right of the fitted line maintain residual native-like interactions in the intermediate. Residues in (i) and (ii) are colored with brown and blue gradients, respectively, with the color of the data points becoming lighter as the ratio |Δδ/Ωsec| deviates from unity, in which |Δδ| was obtained from ϕex assuming p2 = (1.11 ± 0.09)%. (f) Exchange broadened 13Cα and 13C methyl groups are mapped onto the structure of HP67. Atoms are colored to correlate with the classifications depicted in (e). Two regions of residual interactions are maintained the intermediate: (i) at the interface of the N- and C-terminal subdomains and (ii) in the vicinity of His41. Reprinted from N.E. O’Connell, M.J. Grey, Y. Tang, P. Kosuri, V.Z. Miloushev, D.P. Raleigh, A.G. Palmer, Partially folded equilibrium intermediate of the villin headpiece HP67 defined by 13C relaxation dispersion, J. Biomol. NMR 45 (2009) 85–98, with permission from Springer.
Fig. 10
Fig. 10
15N CEST/DEST pulse sequence [103]. Narrow and wide bars depict 90° and 180° pulses, respectively. All pulses are x-phase unless otherwise indicated. The 1H transmitter is positioned on the water resonance throughout the sequence except during the relaxation period T, when it is moved to the center of the amide region (8.4 ppm). The 15N transmitter is placed at 119 ppm except during T, when it is relocated to the desired offset. A coherent decoupling train consisting of 90x240y90x pulses is used for 1H decoupling during T for CEST experiments; decoupling can be obtained with two composite 180° pulses as in Fig. 5 for DEST experiments. In the CEST experiment, temperature compensation is obtained by applying the 1H decoupling scheme for a time TmaxT immediately after the completion of acquisition, in which Tmax is the maximum exchange time used in the experiment (typically T = Tmax or 0). 15N decoupling during acquisition is achieved with WALTZ-16 [165]. Delays are Δ = 1/(4JNH), and ε > Gd. The phase cycle is ϕ1 = {x, −x}, ϕ2 = {y}, ϕ3 = {2x,2y,2(−x), 2(−y)}, ϕ4 = {x}, receiver = {x, −x, −x,x}. Weak bipolar gradients, depicted as solid black bars, are applied during the t1 period. Unlabeled gradients are used to suppress unwanted coherences and artifacts, whereas Ge and Gd are encoding and decoding gradients, respectively, for echo/antiecho coherence selection, obtained by inverting the signs of ϕ4 and Ge [164]. Values of ϕ2 and the receiver phase are inverted between t1 points to shift axial peaks to the edge of the spectrum. A conventional HSQC-detected R1ρ pulse sequence is obtained by replacing the 1H decoupling and 15N spin-lock during T with the scheme (including the adiabatic sweeps) shown in Fig. 5a.
Fig. 11
Fig. 11
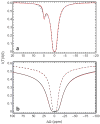
Theoretical (a) CEST and (b) DEST profiles. Calculations assumed kex = 50 s−1, p2 = 0.015, Ω1 = −0.076 ppm, Ω2 = 5 ppm, and T = 0.48 s. ΔΩ is measured relative to the population-averaged resonance position. In (a) R11 = R12 = 1 s−1, R21 = R22 = 20 s−1, ω1/2π = 25 Hz. In (b) R22 = 20,000 s−1 and (dashed) ω1/2π = 150 Hz and (solid) ω1/2π = 300 Hz. Black lines give the numerical solutions of the Bloch–McConnell equations (Eqs. (2)-(4) and (10)) and red lines give the R1ρ approximations using (a) Eqs. (7)-(9) and (12) or (b) Eqs. (7)-(9), (11) and (12). The blue dashed line in (a) shows the result of increasing R22 = 200 s−1 in the CEST experiment, calculated using Eqs. (7)-(9), (11), and (12) as for the DEST experiment.

Similar articles

Cited by

References

    1. Cavanagh J, Fairbrother WJ, Palmer AG, Rance M, Skelton NJ. Protein NMR Spectroscopy: Principles and Practice. second ed. Academic Press; San Diego, CA: 2007.
    1. Forsén S, Hoffman RA. Study of moderately rapid chemical exchange reactions by means of nuclear magnetic double resonance. J Chem Phys. 1963;39:2892.
    1. Gutowsky HS, Saika A. Dissociation, chemical exchange, and the proton magnetic resonance in some aqueous electrolytes. J Chem Phys. 1953;21:1688–1694.
    1. Fejzo J, Westler WM, Macura S, Markley JL. Elimination of cross-relaxation effects from two-dimensional chemical-exchange spectra of macromolecules. J Am Chem Soc. 1990;112:2574–2577.
    1. Palmer AG, Rance M, Wright PE. Intramolecular motions of a zinc finger DNA-binding domain from xfin characterized by proton-detected natural abundance 13C heteronuclear NMR spectroscopy. J Am Chem Soc. 1991;113:4371–4380.

Publication types

LinkOut - more resources