. 2014 Mar 20;53(6):979-92.
doi: 10.1016/j.molcel.2014.02.032.

A role for H3K4 monomethylation in gene repression and partitioning of chromatin readers

Affiliations

A role for H3K4 monomethylation in gene repression and partitioning of chromatin readers

Jemmie Cheng et al. Mol Cell. .

Abstract

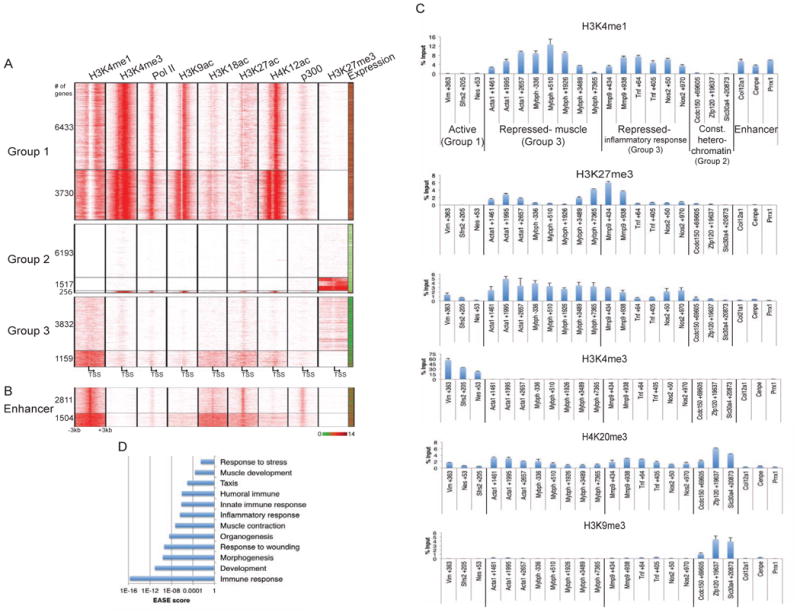
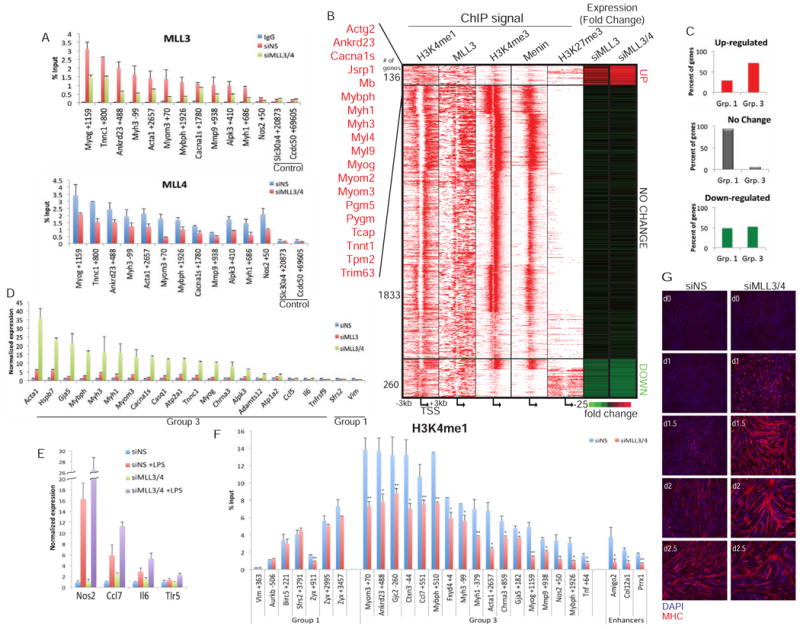
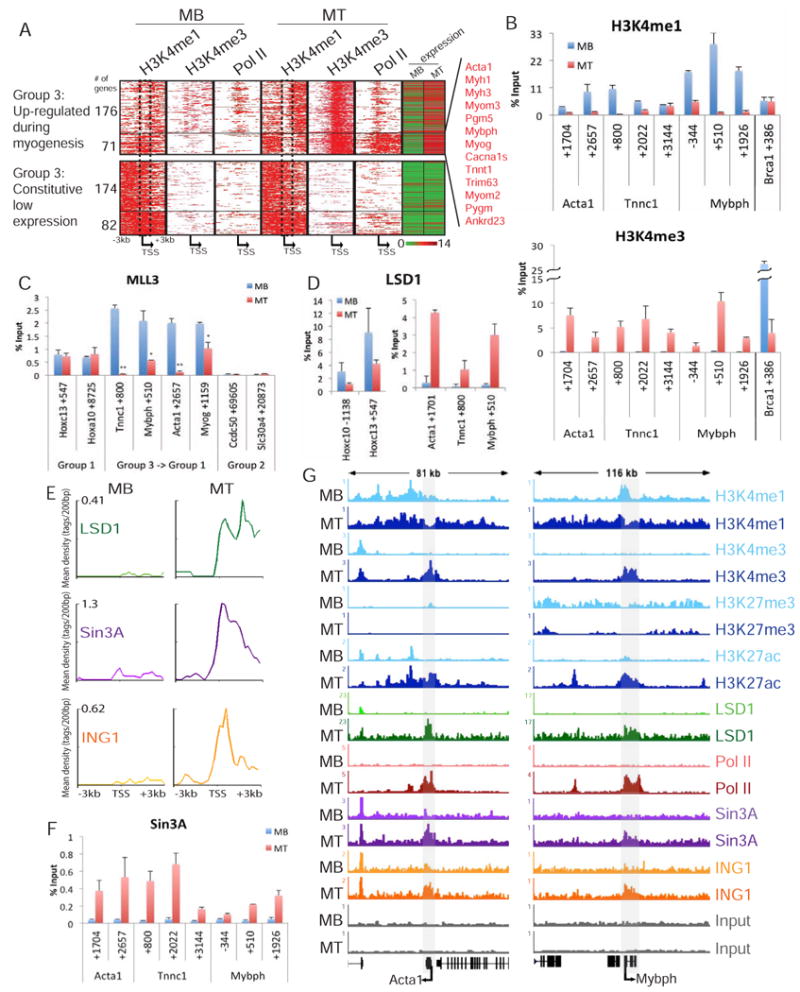
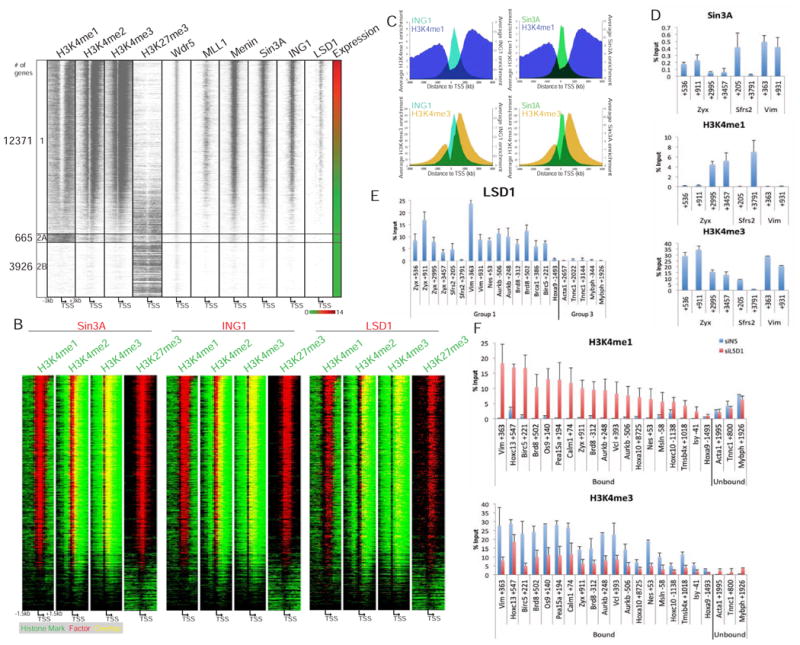
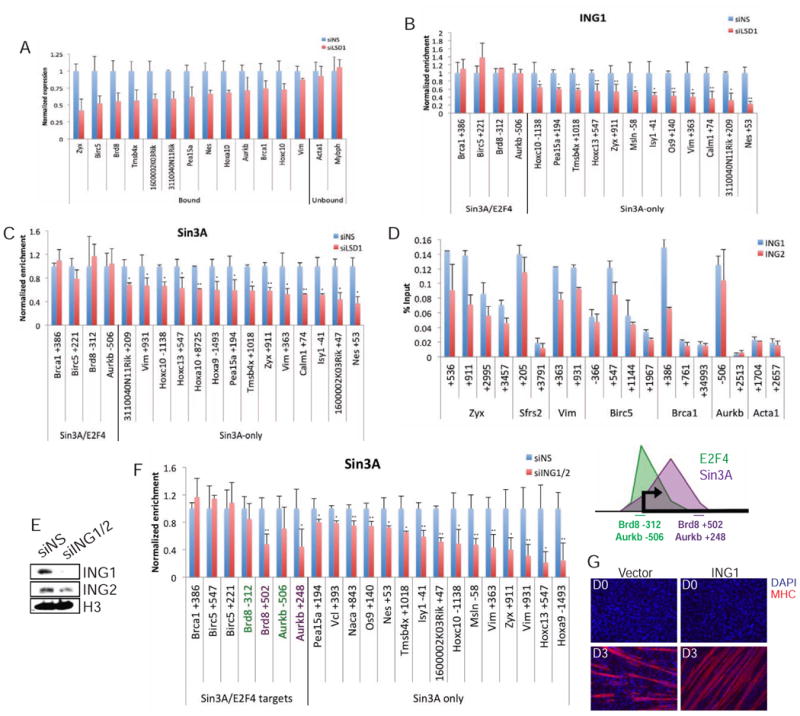
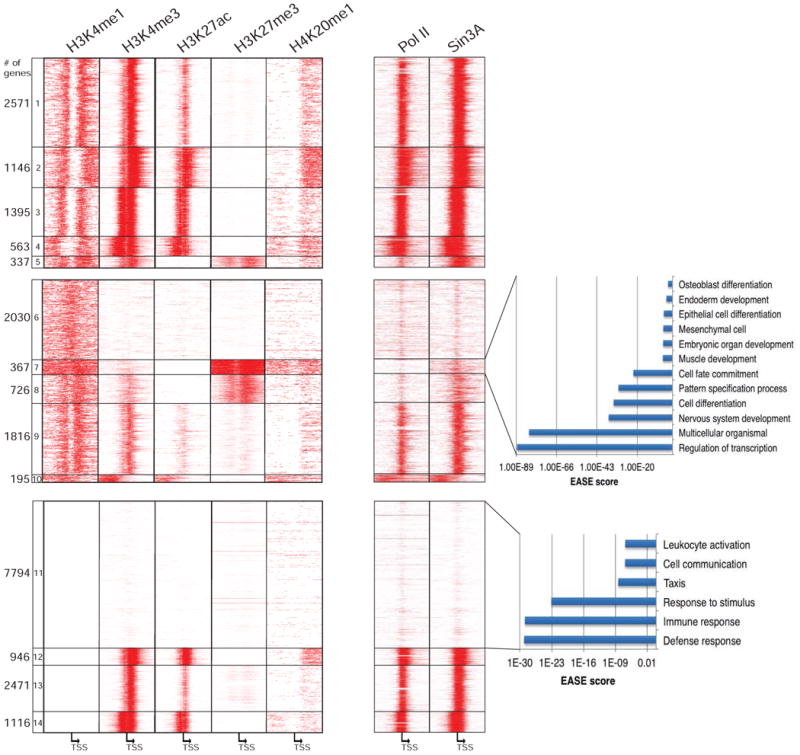
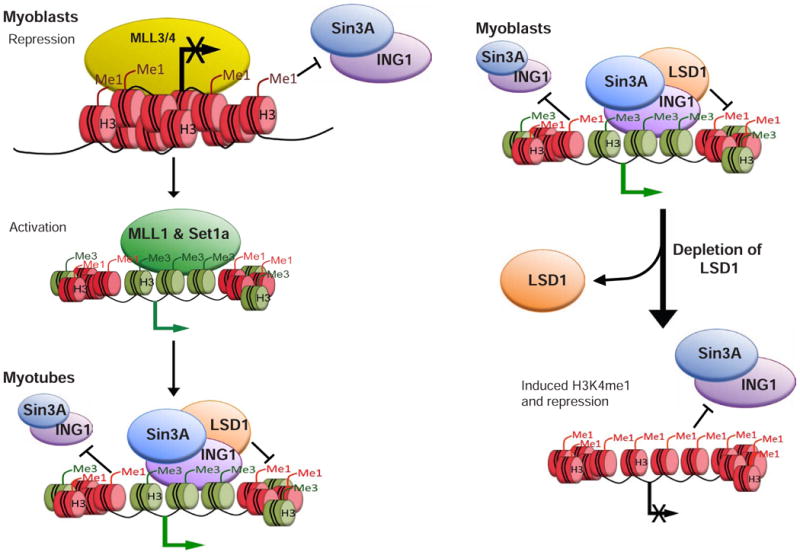
Monomethylation of lysine 4 on histone H3 (H3K4me1) is a well-established feature of enhancers and promoters, although its function is unknown. Here, we uncover roles for H3K4me1 in diverse cell types. Remarkably, we find that MLL3/4 provokes monomethylation of promoter regions and the conditional repression of muscle and inflammatory response genes in myoblasts. During myogenesis, muscle genes are activated, lose MLL3 occupancy, and become H3K4-trimethylated through an alternative COMPASS complex. Monomethylation-mediated repression was not restricted to skeletal muscle. Together with H3K27me3 and H4K20me1, H3K4me1 was associated with transcriptional silencing in embryonic fibroblasts, macrophages, and human embryonic stem cells (ESCs). On promoters of active genes, we find that H3K4me1 spatially demarcates the recruitment of factors that interact with H3K4me3, including ING1, which, in turn, recruits Sin3A. Our findings point to a unique role for H3K4 monomethylation in establishing boundaries that restrict the recruitment of chromatin-modifying enzymes to defined regions within promoters.


Figures

Figure 1
Figure 1. H3K4me1 is associated with features of gene repression and facultative heterochromatin
(a) Genes enriched for H3K4me1 but depleted of H3K4me3 are repressed. All genes were sorted into categories based on enrichment of H3K4me1 and H3K4me3 (Group 1: H3K4me1+/H3K4me3+; Group 2: H3K4me1-; Group 3: H3K4me1+/H3K4me3-). ChIP-seq data were plotted on regions 3 kb upstream and downstream of the TSS and (b) with respect to the midpoint of C2C12 myoblast-specific enhancers identified in Blum et al., 2012. Expression (from Liu el al., 2010) of associated genes is displayed in the far right column. Red-green key indicates relative expression. Numbers of genes in each cluster are displayed on the left. (c) A chromatin signature consisting of H3K4me1, H3K27me3, and H4K20me1 marks the promoters of muscle and inflammatory response (Group 3) genes. qChIP enrichment (presented as percent input) with the indicated antibodies in C2C12 myoblasts for Group 1, 2, and 3 genes and enhancers. Bars indicate SD. (d) H3K4me1 marks inducible genes. GO analysis of genes in Group 3 was performed, and statistically significant enrichments corresponding to EASE scores are plotted on the x-axis (logarithmic scale).
Figure 2
Figure 2. MLL3/4 mediates H3K4 mono-methylation of promoters and repression of Group 3 genes
(a) Specificity of the MLL3 and MLL4 antibodies was determined through qChIP of MLL3 or MLL4 after transfection with a non-specific (NS) control or double knockdown of MLL3/4. Background ChIP signal was determined using an antibody against IgG. (b) MLL3/4 regulate the expression of muscle development Group 3 genes. Differential expression of MLL3 and H3K4me1 target genes after the knock-down of MLL3 or MLL3/4 was determined using RNA-seq (right columns). Up- and down-regulated genes exhibited a ≥2.5 fold change, expression of genes with <1.3 fold change was categorized as no change. A subset of muscle development genes was identified as significantly up-regulated after loss of MLL3/4. ChIP-seq using the indicated antibodies was plotted 3kb upstream and downstream of the TSS. (c) Genes up- or down-regulated and no change genes were identified as belonging to Group 1 or 3 from Figure 1A. Group 2 genes were unaffected by loss of MLL3 alone or MLL3/4. (d) Silencing of MLL3 and MLL3/4 increases the expression of muscle (Group 3) genes as compared to immune response genes (Ccl5, Il6, Tnfsf9) and constitutively expressed genes (Sfrs2, Vim). Expression was normalized to siNS. (e) Knock-down of MLL3/4 followed by LPS treatment leads to enhanced expression of several inflammatory response (Group 3) genes. siNS and siMLL3/4 transfected cells were treated with 100ng/ml LPS for 3 hours. Expression was normalized to siNS. (f) qChIP analysis was carried out to determine the impact of MLL3/4 depletion on deposition of H3K4me1 at promoters. (g) Loss of MLL3/4 leads to enhanced myogenic differentiation. Cells were stained with MHC (red) and DAPI (blue). Day 0 (D0) represents fully confluent cells and the onset of differentiation. Error bars indicate SD. For all qChIP, y-axis represents enrichment as percent input. Student's t test was performed to indicate significance: * indicates p-values <0.05 and ** <0.01, respectively.
Figure 3
Figure 3. Loss of gene repression coincides with dynamic changes in H3K4me1
(a) Transcriptional activation of a subset of Group 3 genes during myogenic differentiation. H3K4me1, H3K4me3, and Pol II ChIP-seq data was plotted for all Group 3 genes up-regulated during myogenesis (top) or a representative subset of genes constitutively expressed at low levels (bottom), as indicated by expression (right column). The bottom cluster of (71) up-regulated genes is enriched with muscle development genes. The dashed box highlights a region that loses H3K4me1 in the 71 genes up-regulated genes. (b, f) Dynamic regulation of H3K4me1, H3K4me3, and Sin3A on muscle development genes in myoblasts (blue) and myotubes (red). (c) Enrichment of MLL3 on constitutively active Group 1, muscle genes that switch from a Group 3 to Group 1 signature, and Group 2 genes during differentiation. (d) Enrichment of LSD1 on Group 3 muscle genes during differentiation compared to constitutively expressed Hoxc cluster genes. (e) Distribution of LSD1, Sin3A, and ING1 ChIP-seq data plotted 3kb upstream and downstream of the TSS of the 71 up-regulated genes identified in Figure 3A (g) Pattern of histone modifications switches from a Group 3 to Group 1 signature across Acta1 and Mybph during differentiation. Read density profile for H3K4me1, H3K4me3, H3K27me3, H3K27ac, LSD1, Pol II, Sin3A, and ING1 across Acta1 and Mybph in myoblasts and myotubes indicated by gray shading. The y-axis corresponds to ChIP-seq signal density. All ChIP data, expressed as percentage of input, are plotted on the y-axis. Error bars indicate SD. Student's t test was performed to indicate significance: * indicates p-values <0.05 and ** <0.01, respectively.
Figure 4
Figure 4. Sin3A is recruited to regions that lack H3K4me1
(a) Genome-wide, Sin3A is recruited to H3K4-trimethylated regions of active promoters. Genes in heat map were sorted based on expression in myoblasts (right-most column). Red-green key indicates relative expression. ChIP-seq data for the indicated antibodies was plotted for regions 3 kb upstream and downstream of the TSS. Cluster 1 includes all expressed genes. Cluster 2A/B includes all non-expressed genes sorted based on pattern of H3K4me1. (b) Heat map indicates overlap of Sin3A, ING1, and LSD1 (red) with H3K4me1, H3K4me2, H3K4me3, and H3K27me3 peaks (green) in a 1.5 kb window upstream and downstream of the TSS of genes in Cluster 1 in a. Regions containing an overlap of factors with histone marks are shown in yellow. (c) ING1 and Sin3A localize to a valley of H3K4me1. ING1 (teal; left panels), Sin3A (green; right panels), H3K4me1 (blue; top panels), and H3K4me3 (yellow; bottom panels) enrichment by ChIP-seq was plotted for regions 3 kb upstream and downstream of the TSS of all myoblast Sin3A target genes. The x- and y-axes represent the distance from the TSS of Sin3A target genes, and average enrichments, respectively. (d) H3K4me1 localization is anti-correlated with H3K4me3 and Sin3A across Zyx, Sfrs2, and Vim. (e) LSD1 localizes to regions on active (Group 1) genes with low H3K4me1 in myoblasts. (f) LSD1 depletion leads to increased enrichment of H3K4me1 (top) and decreased enrichment of H3K4me3 (bottom). qChIP signals expressed as percentage of input are plotted on the y-axis. Error bars indicate SD.
Figure 5
Figure 5. Sin3A recruitment depends on H3K4 methylation state and ING1
(a) qRT-PCR analysis after LSD1 knock-down on genes that differentially recruit this protein. Expression was normalized to the siNS control. (b) LSD1 depletion leads to decreased enrichment of ING1 and Sin3A (c). (d) ING1 and ING2 co-localize on chromatin. (e) After ablation of ING1/2 with siRNA, myoblast extracts were immuno-blotted for ING1, ING2, and H3 (loading control). (f) (Left) ING1/2 depletion leads to strong reductions in Sin3A recruitment to regions bound by Sin3A-only. (Right) Schematic indicating locations of Sin3A/E2F4 target gene primers. (g) The effect of ING1 over-expression on myogenic differentiation. Cells were stained with MHC (red) and DAPI (blue). Day 0 (D0) represents fully confluent cells and the onset of differentiation; D3 indicates differentiation for three days. Student's t test was performed to indicate significance: * indicates p-values <0.05 and ** <0.01, respectively. Error bars indicate SD.
Figure 6
Figure 6. Profiles of H3K4me1, H3K4me3 and Sin3A in H1-hESC
(a) ChIP-seq data for H3K4me1, H3K4me3, H3K27ac, H3K27me3, H4K20me1, Pol II, and Sin3A were obtained from the ENCODE Project Consortium (see Supplemental Experimental Procedures). Genes were sorted as in Figure 1A. (b, c) GO analysis of genes with (b) H3K4me1, H3K27me3, and H4K20me1 and (c) H3K4me1-/H3K4me3- signatures using EASE. The analysis was conducted as in Figure 1C.
Figure 7
Figure 7. Model in which H3K4 methylation state dictates recruitment of ING1 and Sin3A to chromatin
H3K4me1 covers the promoters of a subset of repressed, but inducible, genes. MLL3/4-mediated H3K4me1 is necessary for gene repression. Gene activation coincides with a change in H3K4me1 levels and loss of MLL3/4. On some genes, MLL3/4 are replaced with a distinct COMPASS complex (Set1a or MLL1) able to tri-methylate H3K4 on chromatin linked to the TSS. Although H3K4me3 is necessary for ING1 and Sin3A recruitment, H3K4me1 at the same promoters might restrict the localization of ING1 and Sin3A. Alterations in the ratio of H3K4me1 and H3K4me3 on active genes lead to loss of Sin3A recruitment to chromatin and repression. Multi-valent interaction with sequence-specific factors also contributes to Sin3 recruitment (omitted for simplicity). See text for details.

Comment in

References

    1. Alland L, Muhle R, Hou H, Jr, Potes J, Chin L, Schreiber-Agus N, DePinho RA. Role for N-CoR and histone deacetylase in Sin3-mediated transcriptional repression. Nature. 1997;387:49–55. - PubMed
    1. Agger K, Cloos PA, Christensen J, Pasini D, Rose S, Rappsilber J, Issaeva I, Canaani E, Salcini AE, Helin K. UTX and JMJD3 are histone H3K27 demethylases involved in HOX gene regulation and development. Nature. 2007;449:731–734. - PubMed
    1. Asp P, Blum R, Vethantham V, Parisi F, Micsinai M, Cheng J, Bowman C, Kluger Y, Dynlacht BD. Genome-wide remodeling of the epigenetic landscape during myogenic differentiation. Proc Natl Acad Sci USA. 2011;108:149–158. - PMC - PubMed
    1. Barski A, Cuddapah S, Cui K, Roh TY, Schones DE, Wang Z, Wei G, Chepelev I, Zhao K. High-resolution profiling of histone methylations in the human genome. Cell. 2007;129:823–837. - PubMed
    1. Blais A, van Oevelen CJ, Margueron R, Acosta-Alvear D, Dynlacht BD. Retinoblastoma tumor suppressor protein-dependent methylation of histone H3 lysine 27 is associated with irreversible cell cycle exit. J Cell Biol. 2007;179:1399–1412. - PMC - PubMed

Publication types

MeSH terms

Associated data