

Determining the dynamics of influenza transmission by age
- PMID: 24656239
- PMCID: PMC3997935
- DOI: 10.1186/1742-7622-11-4
Determining the dynamics of influenza transmission by age
Abstract
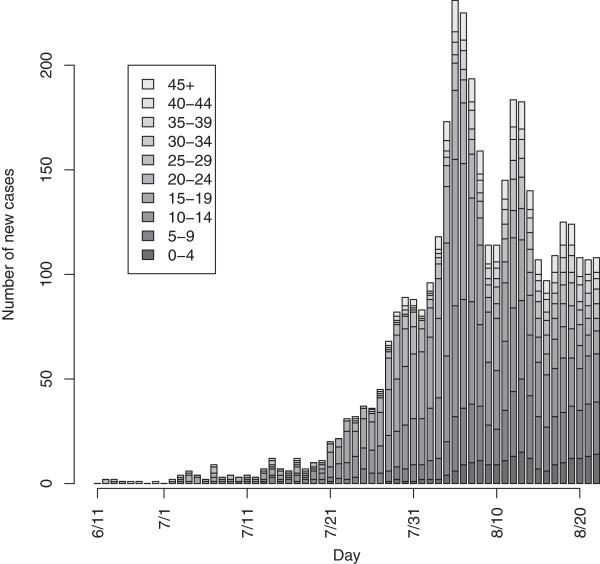
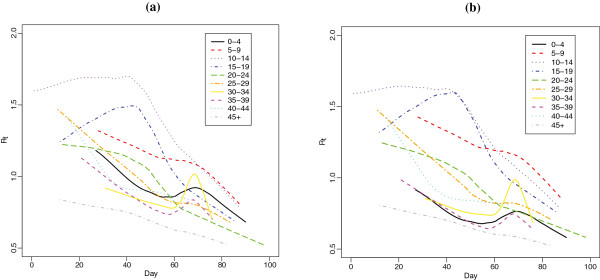
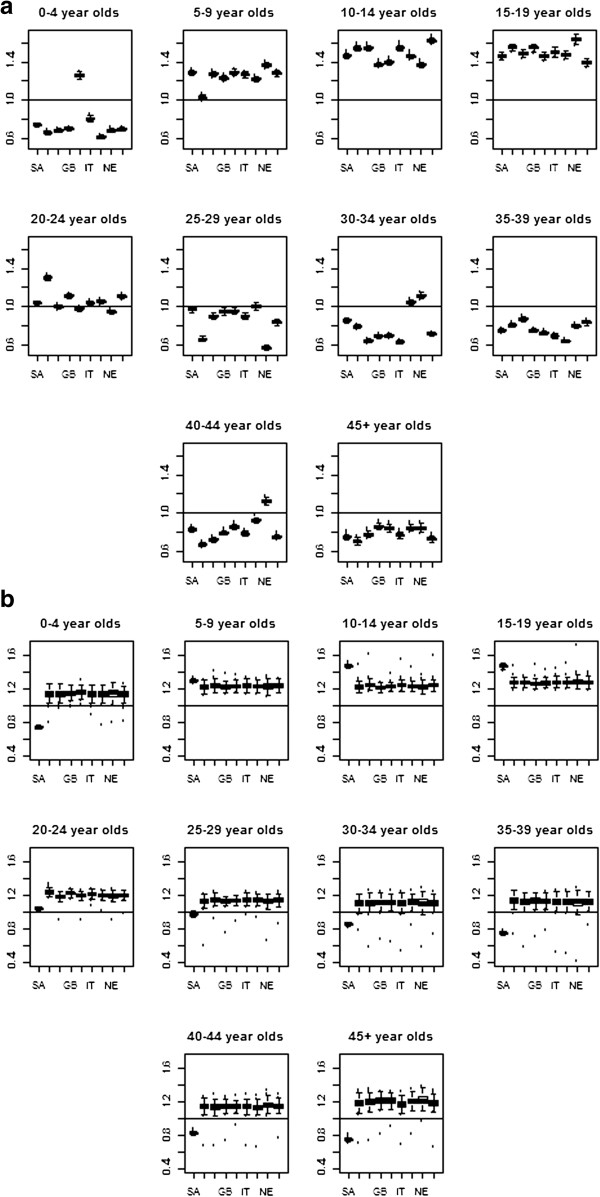
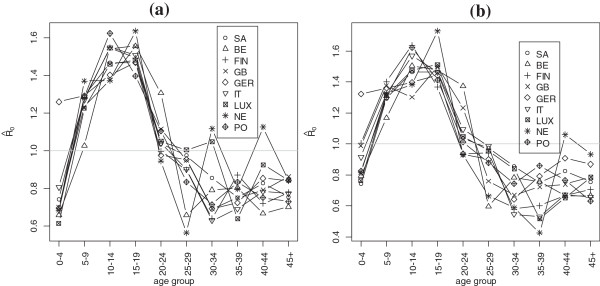
Background: It is widely accepted that influenza transmission dynamics vary by age; however methods to quantify the reproductive number by age group are limited. We introduce a simple method to estimate the reproductive number by modifying the method originally proposed by Wallinga and Teunis and using existing information on contact patterns between age groups. We additionally perform a sensitivity analysis to determine the potential impact of differential healthcare seeking patterns by age. We illustrate this method using data from the 2009 H1N1 Influenza pandemic in Gauteng Province, South Africa.
Results: Our results are consistent with others in showing decreased transmission with age. We show that results can change markedly when we make the account for differential healthcare seeking behaviors by age.
Conclusions: We show substantial heterogeneity in transmission by age group during the Influenza A H1N1 pandemic in South Africa. This information can greatly assist in targeting interventions and implementing social distancing measures.
Figures
References
-
- Mossong J, Hens N, Jit M, Beutels P, Auranen K, Mikolajczyk R, Massari M, Salmaso S, Tomba GS, Wallinga J, Heijne J, Sadkowska-Todys M, Rosinska M, Edmunds WJ. Social contacts and mixing patterns relevant to the spread of infectious diseases. PLoS Med. 2008;5(3):e74. doi: 10.1371/journal.pmed.0050074. - DOI - PMC - PubMed
Grants and funding
LinkOut - more resources
Full Text Sources
Other Literature Sources
