. 2014 Mar 19;81(6):1360-1374.
doi: 10.1016/j.neuron.2014.02.010.

Dorsal raphe neurons signal reward through 5-HT and glutamate

Affiliations

Dorsal raphe neurons signal reward through 5-HT and glutamate

Zhixiang Liu et al. Neuron. .

Abstract

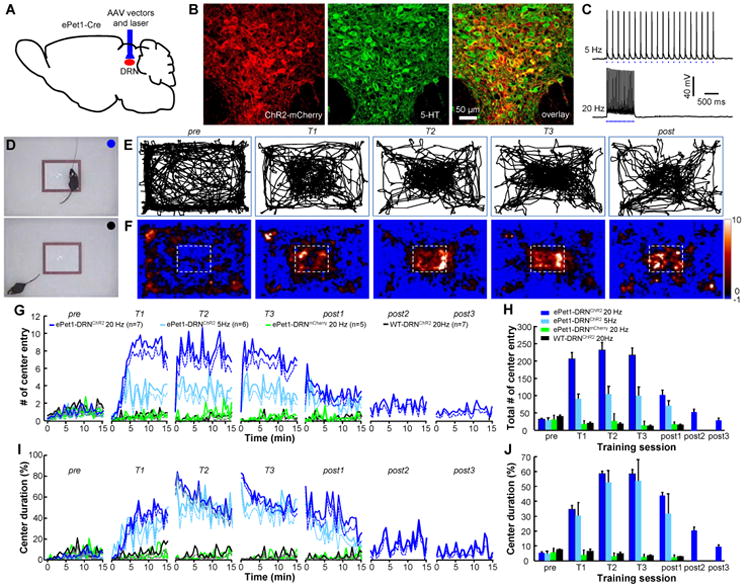
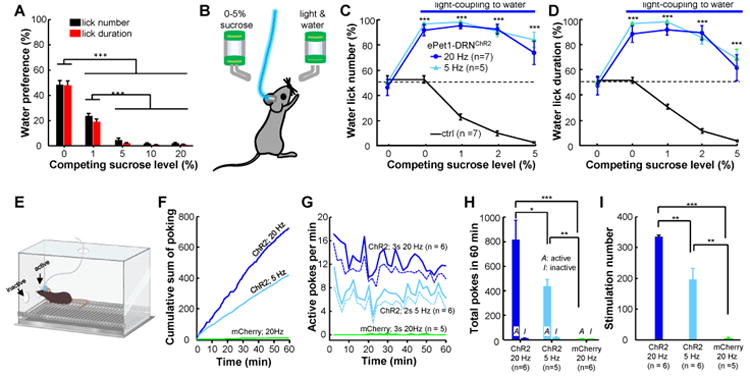
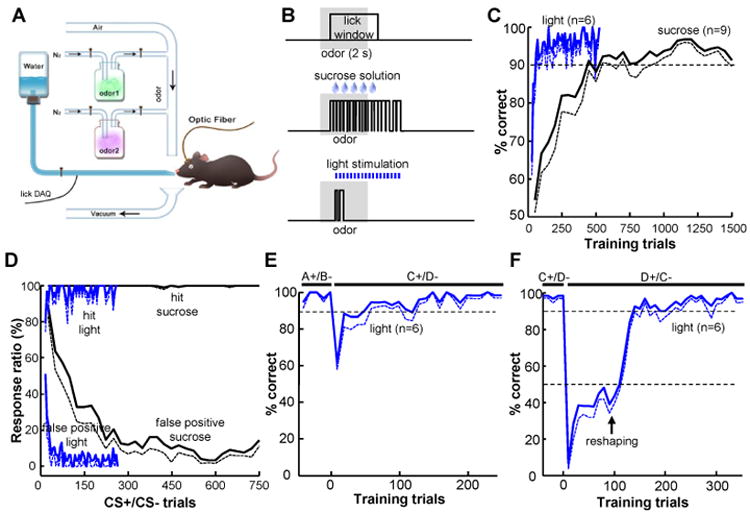
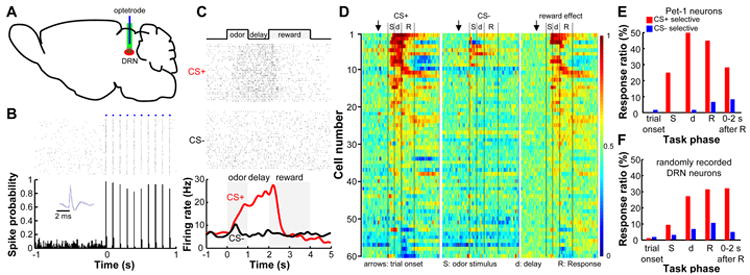
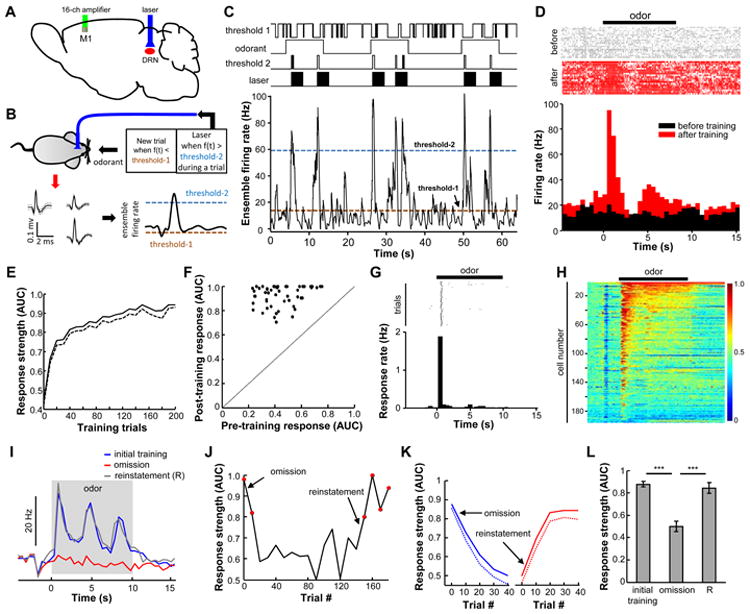
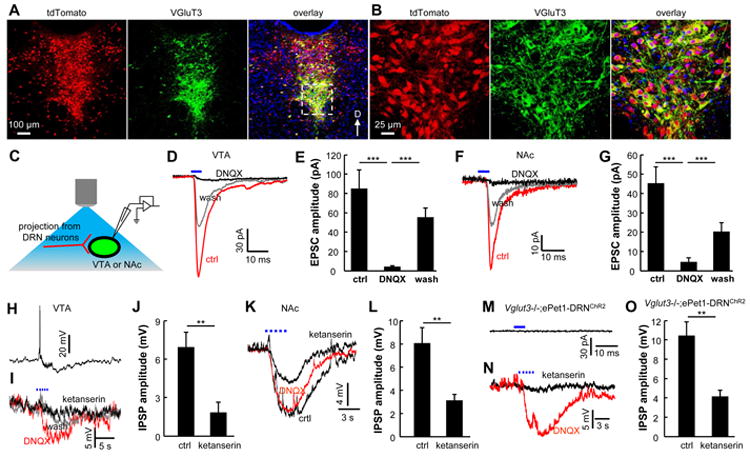
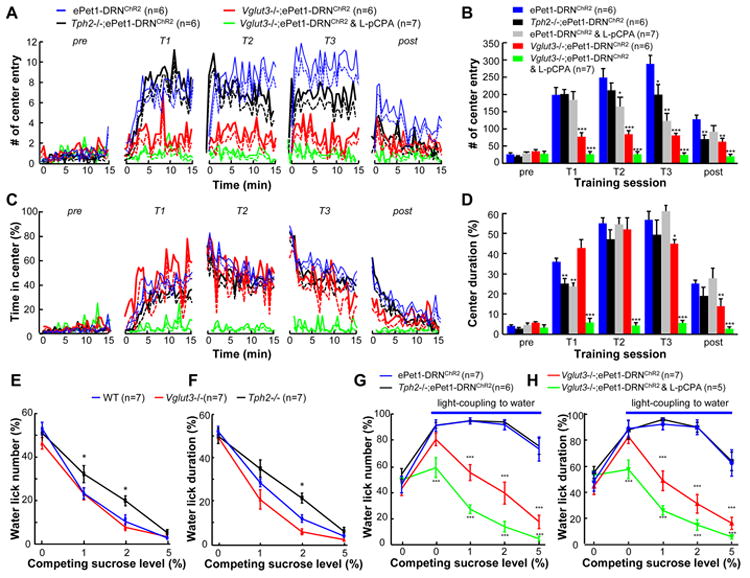
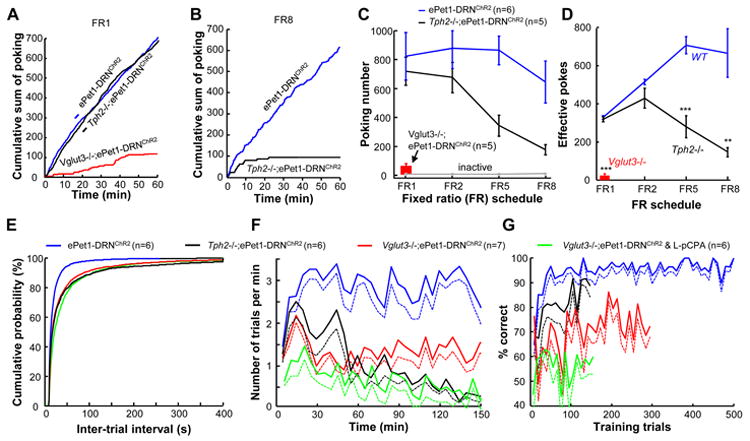
The dorsal raphe nucleus (DRN) in the midbrain is a key center for serotonin (5-hydroxytryptamine; 5-HT)-expressing neurons. Serotonergic neurons in the DRN have been theorized to encode punishment by opposing the reward signaling of dopamine neurons. Here, we show that DRN neurons encode reward, but not punishment, through 5-HT and glutamate. Optogenetic stimulation of DRN Pet-1 neurons reinforces mice to explore the stimulation-coupled spatial region, shifts sucrose preference, drives optical self-stimulation, and directs sensory discrimination learning. DRN Pet-1 neurons increase their firing activity during reward tasks, and this activation can be used to rapidly change neuronal activity patterns in the cortex. Although DRN Pet-1 neurons are often associated with 5-HT, they also release glutamate, and both neurotransmitters contribute to reward signaling. These experiments demonstrate the ability of DRN neurons to organize reward behaviors and might provide insights into the underlying mechanisms of learning facilitation and anhedonia treatment.


Figures

Figure 1
Figure 1. Optogenetic activation of DRN Pet-1 neurons reinforces area-specific exploratory behavior
(A-C) ChR2 was selectively expressed in DRN Pet-1 neurons by infusing AAV-DIO-ChR2-mCherry viral vectors into the DRN of ePet1-Cre mice (A), which drive ChR2-mCherry expression (red in B) in 5-HT neurons (green). Recordings from brain slices demonstrate precise neuronal activation with brief blue light pulses at 5 and 20 Hz (C). (D) The method of iClass training. The body positions of an ePet1-DRNChR2 mouse were video-tracked and light pulses were delivered to the DRN through an optical fiber when the mouse entered the marked center subarea of an open field (blue circle, upper image). Light was not applied when the mouse was out of the center area (black circle; lower image). (E and F) The locomotion tracks (E) and heat maps (F) illustrating the spatial exploration of a mouse before (pre), during (T1-T3), and after (post) iClass training sessions. The color scale at the right indicates the duration in a specific area normalized by the average time if the mouse had lacked any spatial preference. (G and H) Plots of the instantaneous rates (G) and the total number (H) of center entries across sessions (30 s per point) for ePet1-DRNChR2 mice, ePet1-DRNmCherry mice, and nontransgenic littermates injected with AAV-DIO-ChR2-mCherry virus (WT-DRNChR2). The dashed lines indicate mean-SEM. The error bars indicate SEM in this and following figures. (I and J) The instantaneous ratio (I) and the mean ratio (J) of center duration across sessions. p<0.001, Tukey's multiple comparisons between ePet1-DRNChR2 groups and control groups. See also Figures S1, S2 and Movies S1, S2.
Figure 2
Figure 2. Stimulation of DRN Pet-1 neurons shifts sucrose preference and causes operant reinforcement for self-administration
(A) In two-bottle preference tests, wild-type mice exhibited a reduced preference for water when the sucrose concentration was increased in the competing bottle. The preference scores were quantified using either lick numbers (black) or lick duration (red). ***, p < 0.01; One-way ANOVA followed by Tukey's multiple comparisons test; n = 8 mice. (B) The method of testing the effect of DRN neuron activation on shifting sucrose preference. (C and D) Coupling light stimulation to licking for water increased lick numbers (C) and lick duration (D) for water and shifted animal preference away from sucrose. ***, p < 0.001; Two-way ANOVA with Sidak's multiple comparisons between tests with or without light coupling. (E-I) DRN stimulation reinforces operant learning. (E) The method of optical self-stimulation. Mice received DRN light stimulation after nose poking through the ‘active’, but not the ‘inactive’, hole of an operant chamber. (F) Plots of cumulative nose-pokes of individual mice. ChR2-expressing mice, but not the mCherry control animals, vigorously poked the ‘active’ hole for self-stimulation. (G) The rate of active nose pokes across the test sessions of 60 min. ePet1-DRNChR2 mice stably completed ∼12 active pokes/min throughout the test sessions with strong light stimulation (3 s, 20 Hz) and ∼7 pokes/min with weaker stimulation (2 s, 5 Hz), whereas the number of active nose pokes was close to zero for the ePet1-DRNmCherry control mice. (H) Group data showing the total number of active and inactive pokes within a 60-min session. (I) ePet1-DRNChR2 mice earned more than 300 trains of light stimulation with strong stimulation and ∼200 stimulations with weak stimulation, whereas ePet1-DRNmCherry control mice collected only ∼3 stimulations. Due to the 5-s timeout for stimulation delivery, the number of earned stimulations was fewer than that of nose pokes. **, p < 0.01; ***, p < 0.0001; between-group t-tests. See also Movie S3.
Figure 3
Figure 3. Activation of DRN Pet-1 neurons efficiently guides sensory discrimination learning
(A and B) The method of olfactory Go/No-go tests. Mice learned to lick a touch lickometer for sucrose solution or DRN stimulation in response to one of two odorants (A). The time lines of actions for reward trials are shown in (B). We used light stimulation of the DRN (3 s, 20 Hz) instead of sucrose solution for ePet1-DRNChR2mice. (C) The learning curves of odor discrimination for mice trained with the reward of sucrose solution or DRN light stimulation. The dashed curves indicate mean-SEM. (D) The mean ratio of hit responses to CS+ odor and false positive responses to CS- odor. (E) Plot of correct ratio of ePet1-DRNChR2 mice in the switch learning phase, during which the original odorant pair (A+/B-) was changed to a novel pair of odorants (C+/D-). (F) Light stimulation enabled efficient learning of the valence reversal of conditioning odor stimuli (from C+/D- to D+/C-). After odor reversal, the mice abandoned licking in response to both odorants. Sucrose solution was automatically released following the current CS+ odors for 2 or 3 trials, and the licking behavior was ‘reshaped’ for later light stimulation. See also Figure S3.
Figure 4
Figure 4. DRN Pet-1 neurons are activated in response to rewarding stimuli in an olfactory Go/No-go task
(A) DRN neurons were recorded from behaving mice with optetrodes. (B) Raster plot (upper) and peristimulus time histogram (PSTH; lower, bin width = 10 ms) show that light stimulation reliably evoked spike firing of a DRN neuron. The inset shows that light-evoked (blue) and spontaneous (black) spikes had similar waveforms. (C) Raster plot and PSTH (smoothed with a Gaussian kernel, σ=100 ms) of the activity of a DRN Pet-1 neuron aligned to odor onset. (D) Population activity of DRN Pet-1 neurons in the Go/No-go task. Each row represents the activity of a single neuron. For CS+ and CS- trials (left and middle panels), firing rates were compared with the mean rates before trial onset (arrows) to calculate receiver operating characteristic (ROC) values and are represented with colors. AUC, the area under a ROC curve. An AUC value of 0.5 indicates no difference from the mean activity before trial onset. Reward effect (right panel) was computed by comparing the firing rates of CS+ and CS- trials of the same neurons and an AUC value of 0.5 indicates no selectivity. (E) Distribution of identified DRN Pet-1 neurons with significant selective responses to CS+ or CS- within different phases of Go/No-go tasks. (F) Distribution of response selectivity for the 159 randomly recorded DRN neurons without cell-type identification. See also Figure S4.
Figure 5
Figure 5. Phasic activation of the DRN Pet-1 neurons efficiently directs the change of activity patterns of individual cortical neurons
(A) Ensemble spiking activity was recorded from the vM1 of ePet1-DRNChR2 mice implanted with an optical fiber over the DRN for light stimulation. (B) Schematic for the BMI operant task. The ensemble firing rates of vM1 neurons defined odor onset and laser delivery to the DRN. Odorant pulses were applied when the ensemble firing rates were below a pre-determined firing rate (threshold-1). Light pulses (3 s, 20 Hz) were generated when ensemble-firing rates were above a pre-defined high level (threshold-2) during odor presentation. (C) Example traces from a well-trained vM1 ensemble. Neurons responded vigorously and reliably during odorant pulses. (D) Raster plots and PSTH (bin = 0.5 s) showing that an ensemble lacked response to odorants before the BMI task training and responded strongly after training. (E) Averaged learning curve of 52 well-trained ensembles. The dashed line represents mean-SEM. (F) 2-D plot comparing ensemble response strength to the odorant before and after the BMI training. (G) Raster plot and PSTH (bin = 0.5 s), showing the task response frequency of a well-trained vM1 ensemble. Threshold-2 crossing by the ensemble-firing rate was designated as a task response. (H) Heat map showing the ROC representation of PSTH data for all recorded single units (n = 195). (I) Odor-evoked responses of one ensemble were reduced by the omission of light stimulation and recovered after stimulation reinstatement. (J) Time-series plot of response strength showing the effect of stimulation omission and reinstatement on an ensemble. The red dots indicate significant responses (p<0.01; permutation test). (K) Population data showing the effects of stimulation omission and reinstatement across time (n = 14 ensembles from 6 mice). (L) Group data of stimulation omission tests (***, p < 0.001; paired t-test). See also Figure S5.
Figure 6
Figure 6. DRN Pet-1 neurons release 5-HT and glutamate
(A and B) In an ePet1-Cre;Ai14 mouse, VGluT3 (green) is expressed in many tdTomato-labeled neurons (red) along the midline. Panels in (B) show the zoom-in view of the dashed rectangular area in (A). (C) Schematic diagram showing the method of optogenetic stimulation and recordings from the VTA or the NAc in brain slices. (D and E) Representative recording traces from a VTA neuron (D) and group data (E) reveal that brief light stimulation of ChR2+ axonal terminals produced fast EPSCs that were reversibly blocked by DNQX (***, p<0.001; paired t-tests; n = 13 cells). (F and G) Glutamatergic EPSCs were also evoked by single-pulse light stimulations in the NAc shell (***, p<0.001; paired t-tests; n=7 cells). (H and I) Current-clamp recordings from a single VTA neuron show that trains of light pulses (3 s, 20 Hz) resulted in brief excitation, followed by slow inhibition (H). The initial excitatory response was blocked DNQX, whereas the slow inhibitory response was largely abolished by ketanserin, which blocks 5-HT2A and 5-HT2C receptors (I). (J) Group data showing the effect of ketanserin on the slow IPSPs (**, p<0.01; paired t-test; n = 6 cells). (K and L) Slow 5-HT effects were also observed in the NAc (**, p<0.01; paired t-test; n = 7 cells). (M and N) Brief light stimulation failed to elicit any fast EPSC from a cell in the VTA of a Vglut3-/-;ePet1-DRNChR2 mouse (M), but repetitive light stimulation (3 s, 20 Hz) evoked slow IPSP that was largely abolished by ketanserin (N). (O) Group data showing that the slow IPSPs were significantly reduced by ketanserin in Vglut3-/-;ePet1-DRNChR2 mice (*, p<0.01; paired t-test; n = 6 cells). See also Figure S6.
Figure 7
Figure 7. Data from iClass tests and two-bottle preference tests reveal that both 5-HT and glutamate contribute to reward signaling by DRN Pet-1 neurons
(A and B) In iClass tests, Tph2-/-;ePet1-DRNChR2 mice and L-pCPA-treated ePet1-DRNChR2 mice showed a mild but statistically significant reduction in the center entry number for certain training sessions (T2 or T3). Vglut3-/-;ePet1-DRNChR2 exhibited ∼50% reduction in the number of center entries of all training sessions. L-pCPA injection into Vglut3-/-;ePet1-DRNChR2 mice completely abolished the reward effect produced by the activation of DRN Pet-1 neurons.*, p<0.01; ***, p<0.001; t-tests between test groups and ePet1-DRNChR2 control mice. (C and D) The effect of knocking out the Vglut3 gene and/or depleting 5-HT on the center duration. (E and F) The sucrose preference scores quantified with lick numbers and lick duration, respectively. Both Tph2-/- and Vglut3-/- mice preferred sucrose to water, but the sucrose preference scores of Tph2-/- mice were lower than those of wild-type mice at the concentrations of 1 and 2%. *, p < 0.05; Two-way ANOVA and then Dunnett's multiple comparison tests between mutants and WT. (G and H) Sucrose preference scores show that light stimulation of the DRN Pet-1 neurons in Vglut3-/-;ePet1-DRNChR2 mice produced a reward value of ∼1% sucrose. L-pCPA injection into these mice completely disrupted reward signaling. **, p<0.01; ***, p<0.001; one-way ANOVA and then Tukey's post-hoc test between test groups and ePet1-DRNChR2 control mice. See also Figure S7.
Figure 8
Figure 8. Mice lacking Tph2 or VGluT3 show impaired acquisition of self-stimulation and olfactory discrimination learning
(A-D) The behavioral phenotypes of Tph2 and Vglut3 mutant mice in the tests of light self-administration. Vglut3-/-;ePet1-DRNChR2 mice but not Tph2-/-;ePet1-DRNChR2 mice exhibited a dramatic decrease in nose-poking in tests involving an FR1 schedule (A). Tph2-/-;ePet1-DRNChR2 mice responded with much lower intensity than Tph2+/+;ePet1-DRNChR2 mice in tests involving FR5 and FR8 schedules (B-D). In panel (D), a poke is considered effective if it occurred outside of the timeout period. **, p<0.01; ***, p<0.001; t-tests between test groups (Tph2-/- or Vglut3-/-) and the ePet1-DRNChR2 control group. (E-G) Knocking out either the Tph2 gene or the Vglut3 gene disrupted the olfactory discrimination learning directed by the stimulation of DRN Pet-1 neurons. (E) Plots of cumulative probability against inter-trial intervals for different animal groups. Knocking out the Tph2 or Vglut3 gene significantly increased the time required to initiate a new trial during the Go/No-go olfactory discrimination test (p<0.001; Kolmogorov-Smirnov test between knockout and wild-type mice). (F) Plots of trials per minute for different animal groups engaged in olfactory Go/No-go tasks driven by DRN stimulation. (G) The learning curves of different test groups. The plot for ePet1-DRNChR2 mice is derived from Figure 3C. See also Figure S8.

References

    1. Abler B, Gron G, Hartmann A, Metzger C, Walter M. Modulation of frontostriatal interaction aligns with reduced primary reward processing under serotonergic drugs. J Neurosci. 2012;32:1329–1335. - PMC - PubMed
    1. Adamantidis AR, Tsai HC, Boutrel B, Zhang F, Stuber GD, Budygin EA, Touriño C, Bonci A, Deisseroth K, de Lecea L. Optogenetic interrogation of dopaminergic modulation of the multiple phases of reward-seeking behavior. J Neurosci. 2011;31:10829–10835. - PMC - PubMed
    1. Amat J, Baratta MV, Paul E, Bland ST, Watkins LR, Maier SF. Medial prefrontal cortex determines how stressor controllability affects behavior and dorsal raphe nucleus. Nat Neurosci. 2005;8:365–371. - PubMed
    1. Amit Z, Smith BR, Gill K. Serotonin uptake inhibitors: effects on motivated consummatory behaviors. J Clin Psychiatry. 1991;52:55. - PubMed
    1. Berridge KC, Kringelbach ML. Affective neuroscience of pleasure: reward in humans and animals. Psychopharmacology (Berl) 2008;199:457–480. - PMC - PubMed

Publication types