. 2014 Mar 19;81(6):1429-1441.
doi: 10.1016/j.neuron.2014.01.020.

Adaptive gain control during human perceptual choice

Affiliations

Adaptive gain control during human perceptual choice

Samuel Cheadle et al. Neuron. .

Abstract

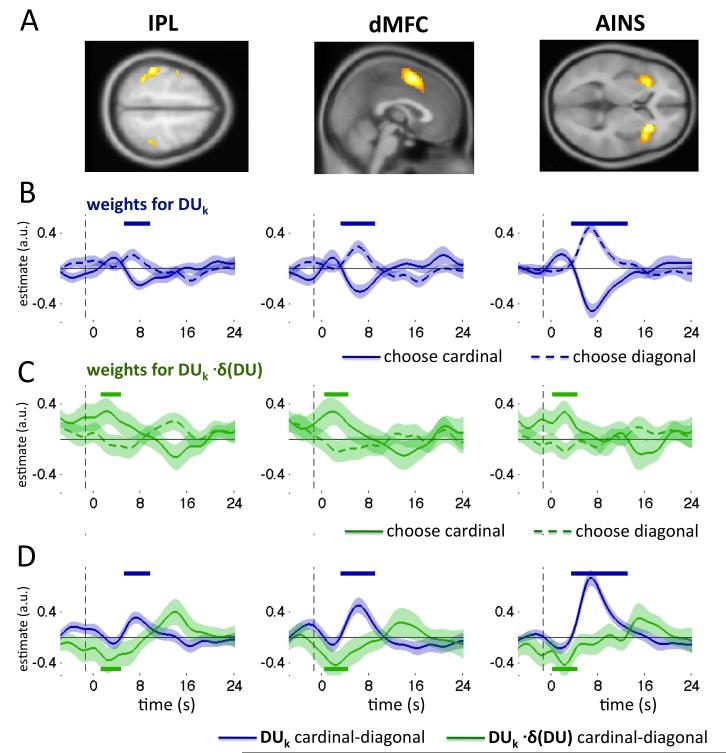
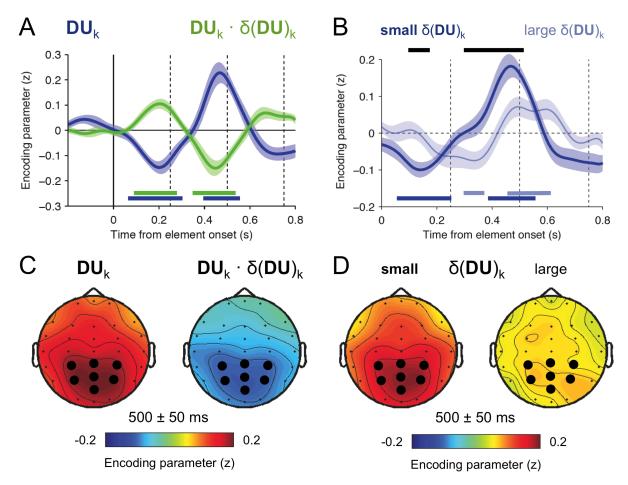
Neural systems adapt to background levels of stimulation. Adaptive gain control has been extensively studied in sensory systems but overlooked in decision-theoretic models. Here, we describe evidence for adaptive gain control during the serial integration of decision-relevant information. Human observers judged the average information provided by a rapid stream of visual events (samples). The impact that each sample wielded over choices depended on its consistency with the previous sample, with more consistent or expected samples wielding the greatest influence over choice. This bias was also visible in the encoding of decision information in pupillometric signals and in cortical responses measured with functional neuroimaging. These data can be accounted for with a serial sampling model in which the gain of information processing adapts rapidly to reflect the average of the available evidence.


Figures

Figure 1
Figure 1
Experimental Design and Model. A. Category-level averaging task. Rapid visual streams of eight oriented Gabor patterns were presented at 4 Hz. Participants reported whether, on average, the tilt of the eight elements fell closer to the cardinal or diagonal axis. B. Schematic illustration of the adaptive transfer function for an example trial. Left panel: samples (blue dots, shaded by their order of occurrence from light to dark) are drawn from a distribution (inverted blue Gaussian) and characterised by a decision update value (position on x-axis). With each new sample, the transfer function (grey lines) shifts fractionally in the direction of the latest sample. Right panel: illustrative gain (difference on y-axis) from two samples (red lines) under two different transfer functions (light and dark grey lines). Gain is maximal when the inflection point of the transfer function coincides with the expectation of the sampling distribution (inverted blue Gaussian), i.e. given the dark grey curve. See also Supplemental Information, Fig. S1.
Figure 2
Figure 2
A. Model predictions using a simulation with arbitrary parameters. Estimated sample coefficients (blue), and consistency coefficients (green), for both an adaptive (top panel / circles) and static (bottom panel / triangles) version of the model. B. Strength of recency (top panel) and consistency (bottom panel) biases, shown for both the adaptive (α = 0.5, filled circles) and static (α = 0, filled triangles) version of the model, for a range of σ values controlling the gain of the nonlinear transfer function. C. Heatmaps showing predicted biases under a broad range of transfer function slope (σ) and learning rate (α) values. Red/yellow colouring shows positive values, blue/cyan shows negative values. Left panel: recency bias (DU5-8-DU1-4) is positive for learning rates greater than 1. Right panel: consistency bias is mostly negative for learning rates greater than 1.
Figure 3
Figure 3
Behavioural results and model predictions. A. Experiment 1 B. Experiment 2. Regression coefficients from behavioural data (filled colour circles), together with adaptive model predictions (lines), estimated using a multivariate logistic regression of choice against a linear combination of factors. Blue dots and lines: sample coefficients wk for the eight sample decision updates (wk). Green dots and lines: consistency coefficients wδk indicating the influence of disparity between samples. Solid lines plot model predictions based on analytically derived parameter values, fitting against choice data. Dashed lines plot model predictions based on an exhaustive search over parameter space, minimising the mean squared error between behavioural and model parameter estimates. Error bars indicate +-1 S.E. See also Supplemental Information, Fig. S3.
Figure 4
Figure 4
Pupil dilation in response to decision information. A. Pupil dilation over the course of a trial expressed as the proportion change relative to a pre-sequence baseline level. Vertical lines represent the onset of the 8 decision-relevant samples. B. Regression coefficents showing the encoding of decision information in pupil diameter (eq. 6) for the time window −500 to +2500ms relative to the onset of each sample. Blue curves - coefficents for decision update wk. Green coefficients for disparity interaction wδk. Each curve reflects coefficients averaged across samples 2 – 8. Coloured horizontal bars indicate regions of significance against baseline at the level p<0.05 uncorrected (light) and corrected (dark) for multiple comparisons. C. Pupil dilation encoding timecourse of decision update DUk divided into conditions of either small or large δ(DU)k – i.e. large or small shifts in decision space between the preceding (k-1) and current (k) sample – divided on the basis of a median split on δ(DU)k. Coloured horizontal bars indicate regions of significant difference between low and high δ(DU)k at p<0.05 uncorrected (light) and corrected (dark) for multiple comparisons. D. Pupil encoding timecourse of decision update DUk, for early (position 2-4) vs late (position 5-8) occurring samples. See also Supplemental Information, Fig. S4.
Figure 5
Figure 5. fMRI data
A. Clusters selected as regions of interest: IPL, dMFC and AINS, rendered onto axial/sagittal slices of the template brain of the Montreal Neurological institute at a threshold of p < 0.00001 uncorrected. B. Encoding of DUk (i.e. evidence favouring cardinal) in BOLD signals as a function of time in seconds (x-axis) for trials on which cardinal (solid blue line) or diagonal (dashed blue line) were chosen. Shading around each line shows standard error of the mean. Upper blue bars denote timepoints where encoding curves diverge significantly, at p<0.05. C. As for B, but plotting consistency coefficients wδk for BOLD signals. Green bars denote significant timepoints. D. Plot of the difference between encoding for each choice in A and B. Blue lines: divergence between encoding of DUk for the two choices. Green lines: divergence between encoding of DUk · δ(DU)k for the two choices. See also Supplemental Information, Fig. S5 and Tables S1-S3.
Figure 6
Figure 6
EEG response to decision information. A. EEG encoding timecourse of decision information. Blue - decision update coefficients wk. Green – disparity interaction coefficients wδk. Curves display parameter coefficients from the multivariate regression of EEG signal amplitude against a linear combination of decision factors (eq. S4) for the time window −200 to +800ms relative to the onset of each sample. Each curve reflects coefficients averaged across samples 2 – 8. Coloured horizontal bars indicate regions of significance at the level p<.05 uncorrected for both wk (blue) and wδk (green). B. Timecourse of decision update DUk divided into conditions of either small (dark blue) or large (light blue) inter-item disparity across decision space (δ(DU)k), divided on the basis of a median split. Coloured horizontal bars indicate significance against baseline and black bars indicate regions of significant difference between low and high δ(DU)k, both at p<0.05 uncorrected. C. EEG encoding topographies of decision information at 500 ms following the corresponding element. Blue - decision update DUk. Green - disparity interaction DUk · δ(DU)k. Large dots indicate parietal electrodes of interest (CP3, CPz, CP4, P3, Pz, P4, POz). D. EEG encoding topographies for DUk divided into conditions of either small (left) or large (right) inter-item disparity across decision space, divided on the basis of a median split. Same conventions as in C. See also Supplemental Information, Fig. S6.
Figure 7
Figure 7
Adaptive (A) and static (B) model predictions for different sequence classes. Decision weighting profiles based on four item sequences (experiment 4), estimated using a multivariate logistic regression of choice against a linear combination of the four decision updates. Behavioural weighting coefficients (filled grey bars) are displayed for three cardinal (C) - diagonal (D) sequence types, alternating (C-D-C-D or D-C-D-C), pairs (C-C-D-D or D-D-C-C) and sandwich (C-D-D-C or D-C-C-D).. Adaptive gain model parameter estimates from twenty separate runs are plotted for both adaptive (A, red circles) and static (B, blue circles), based on exhaustively searching over parameter space, minimising the MSE between behavioural and model parameter estimates. See also Supplemental Information, Fig. S7.

Comment in

  • Summary statistics. Weighting for the end.
    [No authors listed] [No authors listed] Atten Percept Psychophys. 2014 Jul;76(5):1253. doi: 10.3758/s13414-014-0726-z. Atten Percept Psychophys. 2014. PMID: 24961646 No abstract available.

References

    1. Aston-Jones G, Cohen JD. Adaptive gain and the role of the locus coeruleus-norepinephrine system in optimal performance. J Comp Neurol. 2005;493:99–110. - PubMed
    1. Barlow H. Sensory Communication. MIT Press; 1961. Possible principles underlying the transformation of sensory messages.
    1. Bartlett NR. Dark and light adaptation. In: Graham CH, editor. Vision and visual perception. John Wiley and Sons, Inc; New York: 1965. 1965. (New York: John Wiley and Sons, Inc.)
    1. Beck JM, Ma WJ, Kiani R, Hanks T, Churchland AK, Roitman J, Shadlen MN, Latham PE, Pouget A. Probabilistic population codes for Bayesian decision making. Neuron. 2008;60:1142–1152. - PMC - PubMed
    1. Bogacz R, Brown E, Moehlis J, Holmes P, Cohen JD. The physics of optimal decision making: a formal analysis of models of performance in two-alternative forced-choice tasks. Psychol Rev. 2006;113:700–765. - PubMed

Publication types