. 2014 Apr 14;25(4):442-54.
doi: 10.1016/j.ccr.2014.02.010. Epub 2014 Mar 20.

The R882H DNMT3A mutation associated with AML dominantly inhibits wild-type DNMT3A by blocking its ability to form active tetramers

Affiliations

The R882H DNMT3A mutation associated with AML dominantly inhibits wild-type DNMT3A by blocking its ability to form active tetramers

David A Russler-Germain et al. Cancer Cell. .

Abstract

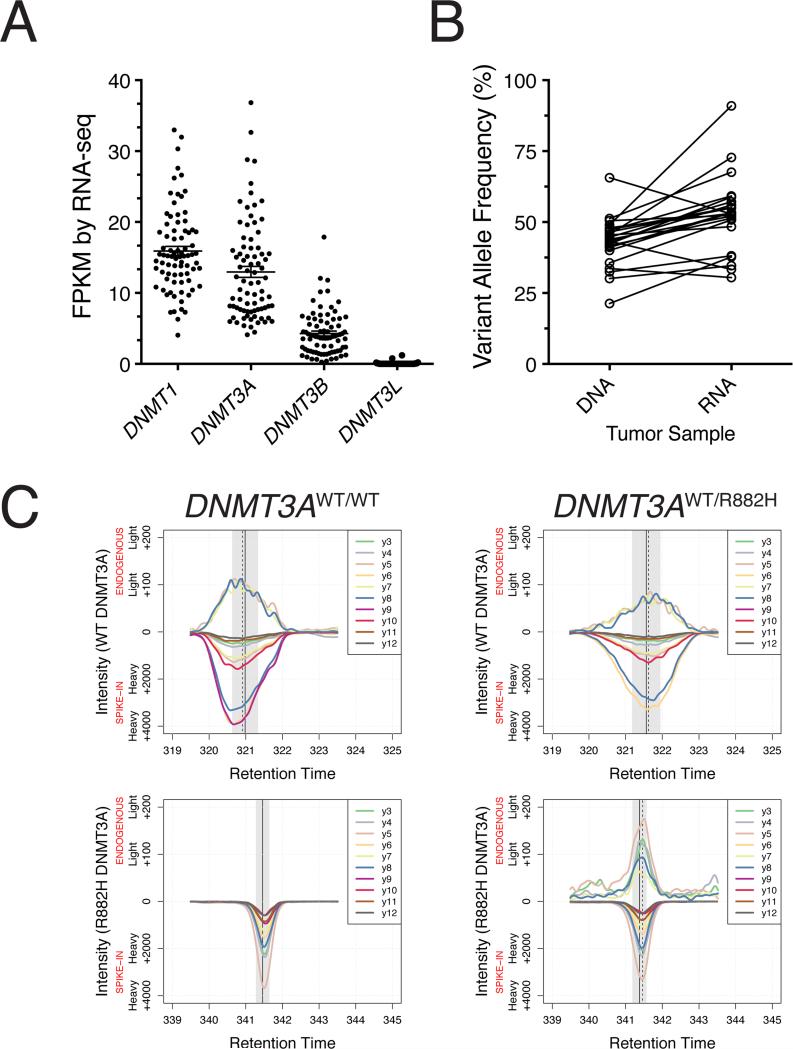
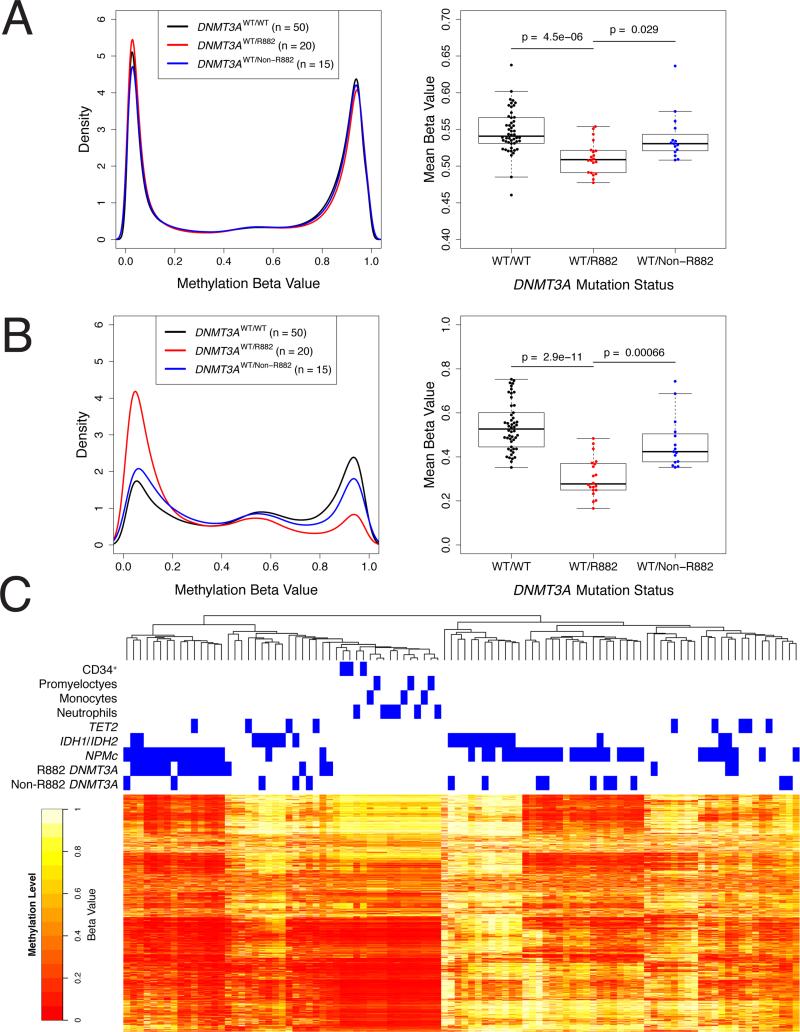
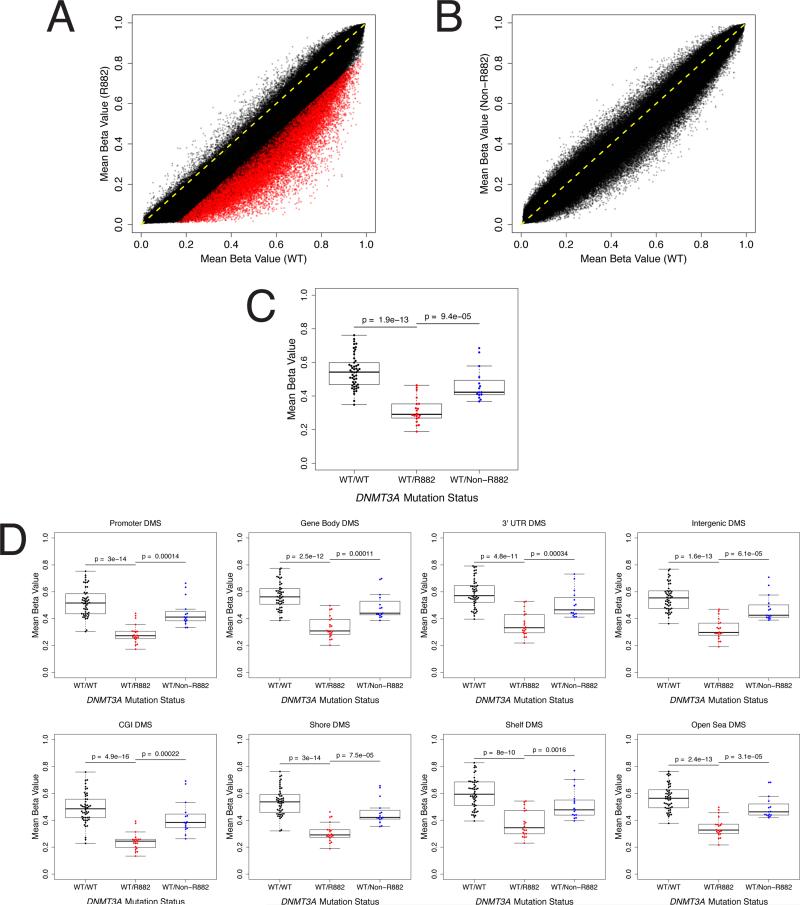
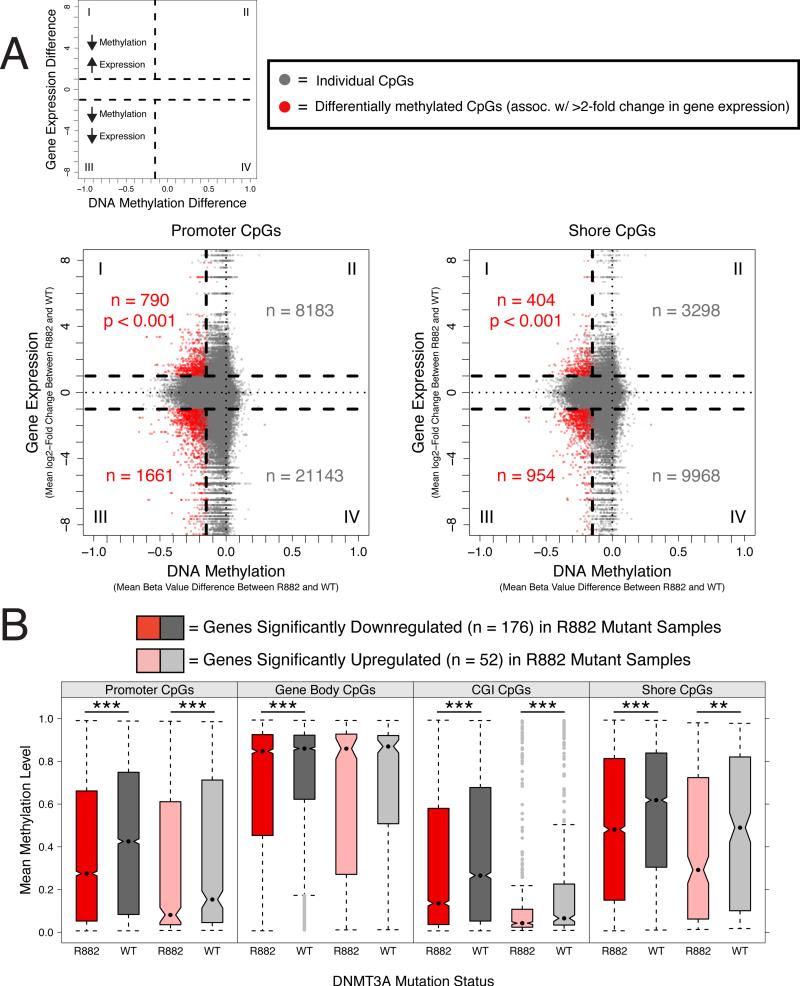
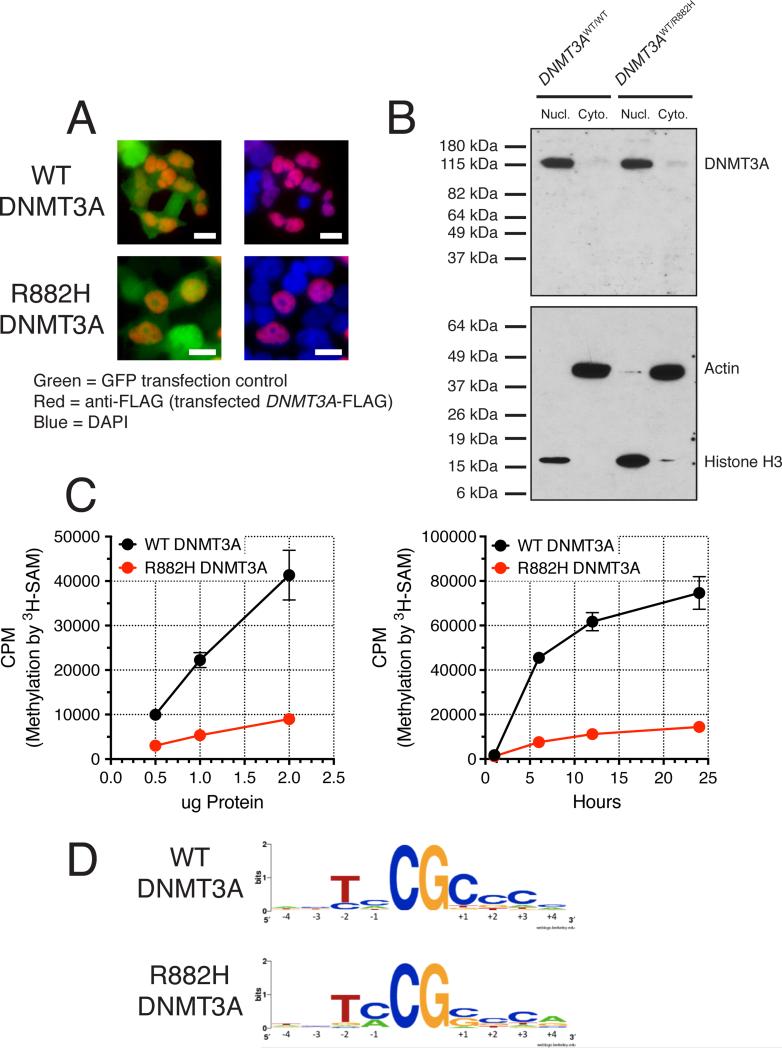
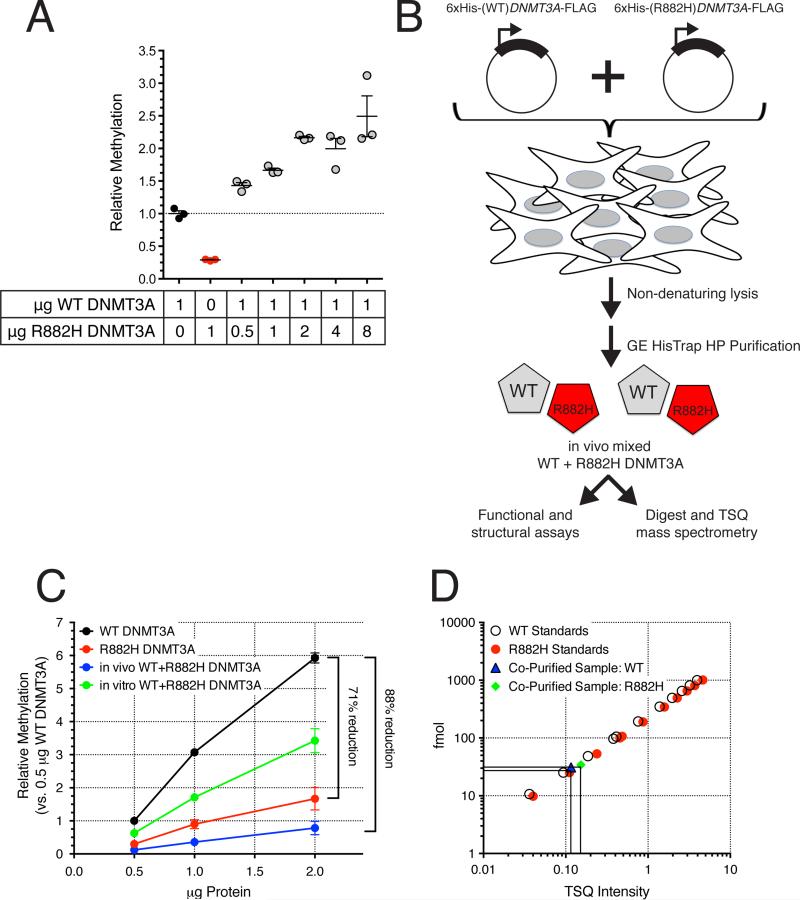
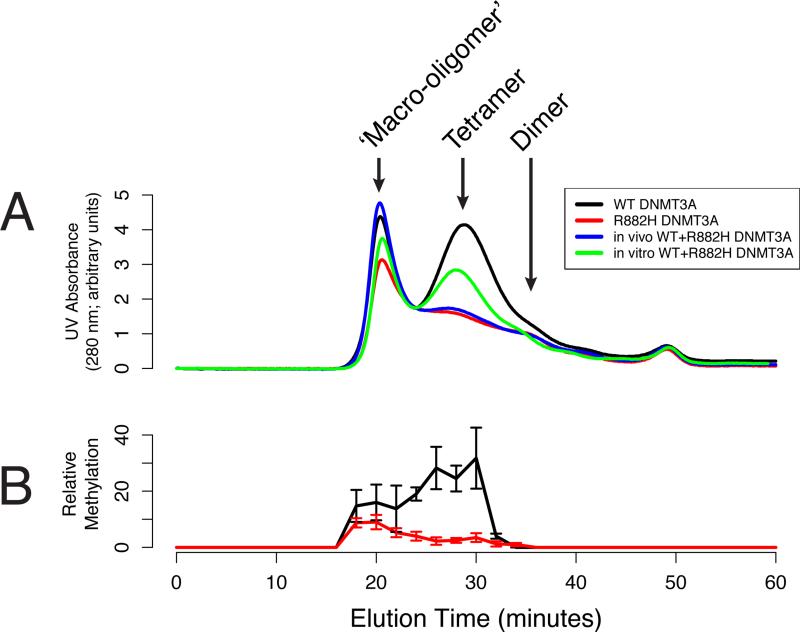
Somatic mutations in DNMT3A, which encodes a de novo DNA methyltransferase, are found in ∼30% of normal karyotype acute myeloid leukemia (AML) cases. Most mutations are heterozygous and alter R882 within the catalytic domain (most commonly R882H), suggesting the possibility of dominant-negative consequences. The methyltransferase activity of R882H DNMT3A is reduced by ∼80% compared with the WT enzyme. In vitro mixing of WT and R882H DNMT3A does not affect the WT activity, but coexpression of the two proteins in cells profoundly inhibits the WT enzyme by disrupting its ability to homotetramerize. AML cells with the R882H mutation have severely reduced de novo methyltransferase activity and focal hypomethylation at specific CpGs throughout AML cell genomes.


Figures

Figure 1
Figure 1. Expression of DNA Methyltransferase Genes in Normal Karyotype (NK)-AML Samples
(A) FPKM expression of DNA methyltransferase family genes in NK-AML by RNA-seq (n = 80). (B) Variant allele frequency (%) of R882 mutant DNMT3A in NK-AML tumor DNA and RNA. Each set of connected points corresponds to a single patient (n = 23). (C) TTOF mass spectrometry identification of WT and R882H DNMT3A in primary NKAML cell lysates. X-axis reflects peptide retention time (minutes), which distinguishes between the two peptides that define WT vs. R882H DNMT3A proteins. Y-axis reflects signal intensity for heavy peptides ([13C6][15N4]-labeled internal standard synthetic peptides corresponding to WT or R882H DNMT3A; negative on axis) or light peptides (endogenous, native WT and R882H DNMT3A; positive on axis), based on specific y-series ion transitions (curves y3-y12). All endogenous DNMT3A signals exhibiting mean retention times (dashed vertical lines) within the 95% CI of the heavy internal standard mean retention time (vertical gray shading and solid vertical lines) are shown. See also Figure S1.
Figure 2
Figure 2. DNA Methylation Profiling of NK-AML Samples Identifies a Focal Hypomethylation Phenotype Associated with DNMT3A R882 Mutations
(A) Aggregate density distribution of methylation beta values for all CpGs for all patients based on DNMT3A mutation status (black = DNMT3AWT/WT [n = 50], red = heterozygous DNMT3A mutation at R882 [n = 20], blue = non-R882 mutation in DNMT3A [n = 15]). Mean methylation beta values are shown for all CpGs for each patient based on the DNMT3A mutation status. P-values were calculated by t-tests corrected for multiple testing. (B) Aggregate density distribution of methylation beta values for the 5,000 most variably methylated CpGs for all samples (categorized by DNMT3A mutation status: black = DNMT3AWT/WT [n = 50], red = heterozygous DNMT3A mutation at R882 [n = 20], blue = non-R882 mutation in DNMT3A [n = 15]). Mean methylation beta values are shown for each patient (categorized by DNMT3A mutation status) for the 5,000 most variably methylated CpGs. P-values were calculated by t-tests corrected for multiple testing. (C) Heatmap representation of unsupervised hierarchical clustering of 85 NK-AML cases and 15 normal human bone marrow-derived samples (enriched CD34+ cells, promyelocytes, neutrophils, or monocytes), based on methylation beta values for the 5,000 most variably methylated CpGs in the sample set. The methylation beta value for each CpG is represented by a color scale (red = less methylated, yellow/white = more methylated). CpG probes were ordered by similarity, as assessed by hierarchical clustering analysis. The mutation status of relevant, recurrently mutated genes in these NK-AML samples is indicated above the heatmap. See also Figure S2 and Table S1.
Figure 3
Figure 3. Differential Methylation in NK-AML Samples with R882 Mutant DNMT3A
(A) Scatter plot comparing mean methylation beta values at individual CpGs across all NK-AML cases categorized by DNMT3A mutation status (WT vs. R882 mutant). Individual points represent single CpGs (x-axis = mean methylation beta value for all WT samples; y-axis = mean methylation beta value for all R882 mutant samples). CpGs with equal mean methylation beta values between WT and R882 samples appear along the line Y=X, indicated in yellow. CpGs hypomethylated in R882 samples appear below the line Y=X. CpGs that were differentially methylated between the two sample sets (FDR < 0.01 and absolute value of mean methylation difference > 0.15) are indicated in red. (B) Scatter plot comparing mean methylation beta values at individual CpGs across all NK-AML cases categorized by DNMT3A mutation status (WT vs. non-R882 mutant). Individual points represent single CpGs (x-axis = mean methylation beta value for all WT samples; y-axis = mean methylation beta value for all non-R882 mutant samples). CpGs with equal mean methylation beta values between WT and non-R882 samples appear along the line Y=X, indicated in yellow. CpGs hypomethylated in non-R882 samples appear below the line Y=X. CpGs that were differentially methylated between the two sample sets (FDR < 0.01 and absolute value of mean methylation difference > 0.15) are indicated in red. (C) Mean methylation beta values are shown for each patient (categorized by DNMT3A mutation status) for the 29,660 differentially methylated CpGs (by supervised analysis between WT and R882 mutant samples). P-values were calculated by t-tests corrected for multiple testing. (D) Mean methylation beta values are shown for each patient (categorized by DNMT3A mutation status) for subsets (based on CpG relationship to gene loci or CGIs) of the 29,660 differentially methylated CpGs (by supervised analysis between WT and R882 mutant samples). P-values were calculated by t-tests corrected for multiple testing. See also Figure S3 and Table S2.
Figure 4
Figure 4. Effects of DNMT3A Mutations on the Relationship Between DNA Methylation and Gene Expression in NK-AML
(A) Variable expression changes are observed in genes associated with differentially methylated promoter or shore CpGs in R882 mutant DNMT3A NK-AML samples. Each data point in the starburst plots represents the mean DNA methylation (x-axis) and mean gene expression (y-axis, log2-fold change) difference at an individual CpG comparing WT and R882 mutant DNMT3A samples. Data points in red are CpGs exhibiting significant differential methylation (by supervised analysis between WT and R882 mutant samples) and also >2-fold changes in expression of their associated genes. Genes associated with significantly hypomethylated promoter or shore CpGs were statistically enriched for upregulated genes relative to the overall gene expression changes between WT and R882 mutant samples (p < 0.001 for both promoter and shore CpGs by Chi-squared with Yates’ correction; contingency table = quadrants I/III vs. II/IV). Gene body and CGI CpGs are shown in Figure S4C. (B) Differentially expressed genes in R882 mutant NK-AML consistently exhibit hypomethylation. Box-and-whisker plots compare R882 mutant and WT samples by mean methylation levels of individual promoter, gene body, CGI, or shore CpGs associated with either significantly downregulated (n = 176) or upregulated genes (n = 52) in R882 mutant NK-AML. p < 0.05 denoted by ‘*’, p < 0.005 denoted by ‘**’, and p < 0.0005 denoted by ‘***’ by Wilcoxon signed-rank test corrected for multiple testing. Note that both upregulated and downregulated differentially expressed genes are hypomethylated in R882 mutant samples. See also Figure S4 and Tables S3 and S4.
Figure 5
Figure 5. Cellular Localization and Function of R882H DNMT3A Protein
(A) Immunofluorescence imaging of FLAG-tagged WT and R882H DNMT3A. Note that WT and R882H DNMT3A proteins have the same nuclear distribution. The scale bar indicates 10 μm. (B) Nuclear/cytoplasmic fractionation of primary NK-AML cells (WT/WT and WT/R882H for DNMT3A) to assess DNMT3A nuclear localization. Top panel = western blot with anti-DNMT3A antibody. Bottom panel = western blot with anti-histone-H3 (nuclear) and anti-actin (cytoplasmic) antibodies. Lanes were loaded with identical cell equivalents of lysate volumes. (C) In vitro methylation of a linearized plasmid DNA substrate (pcDNA3.1) by recombinant full-length human WT DNMT3A or R882H DNMT3A: dose-response assay with 6-hour incubation, and time-course assay using 1 μg total protein per reaction (250 nM). Data are means +/- SEM of three independent experiments, each performed in triplicate. (D) LOGOS motifs demonstrating preferentially methylated CpG sequences of WT and R882H DNMT3A based on bisulfite sequencing of in vitro methylated DNA templates. See also Figure S5.
Figure 6
Figure 6. Dominant Negative Effects of Recombinant R882H DNMT3A Protein are Found Only After “In Vivo” Mixing
(A) In vitro methylation assay of linearized pcDNA3.1 using recombinant full-length human WT, R882H, or in vitro mixed WT and R882H DNMT3A. (B) Schematic of co-transfection/co-purification of WT and R882H DNMT3A for structure/function analysis and TSQ mass spectrometry quantification of DNMT3A proteins. (C) In vitro methylation assay of linearized pcDNA3.1 using WT, R882H, in vitro mixed WT and R882H DNMT3A, vs. co-transfected/co-purified “in vivo mixed WT and R882H DNMT3A. Data are means +/- SEM of four independent experiments, each performed in triplicate. (D) Example of WT:R882H DNMT3A ratio quantification by TSQ mass spectrometry in “in vivo” mixed samples. Open circles = WT DNMT3A standards; red closed circles = R882H DNMT3A standards; blue triangle = WT DNMT3A peptide from co-purified WT+R882H sample; green diamond = R882H DNMT3A peptide from co-purified WT+R882H sample.
Figure 7
Figure 7. R882H DNMT3A Fails to Form Homotetramers, and Blocks WT Homotetramer Formation in a Dominant Negative Fashion
(A) Size exclusion chromatography tracings of DNMT3A complexes (WT = black; R882H = red; co-transfected/co-purified “in vivo” mixed WT and R882H = blue; in vitro WT and R882H DNMT3A = green). X-axis = Superose 6 column elution time (run at 0.5 mL/min; 20 minutes = ~800 kDa estimated molecular weight, 30 minutes = ~450 kDa estimated molecular weight). Y-axis = arbitrary units of UV280 nm absorption of column eluates. (B) Methyltransferase activity of WT DNMT3A or R882H DNMT3A complexes (purified with size exclusion chromatography) assessed by bisulfite pyrosequencing of column fractions after in vitro methylation reactions. X-axis = Superose 6 column elution time (run at 0.5 mL/min; 20 minutes = ~800 kDa estimated molecular weight, 30 minutes = ~450 kDa estimated molecular weight). Y-axis = relative methyltransferase activity, calculated as the sum of methylation beta values across all 14 CpGs within the pyrosequencing amplicon. Data are means +/- SEM of three independent experiments.

References

    1. Anders S, Huber W. Differential expression analysis for sequence count data. Genome Biol. 2010;11:R106. - PMC - PubMed
    1. Berman BP, Weisenberger DJ, Aman JF, Hinoue T, Ramjan Z, Liu Y, Noushmehr H, Lange CPE, van Dijk CM, Tollenaar RAEM, et al. Regions of focal DNA hypermethylation and long-range hypomethylation in colorectal cancer coincide with nuclear lamina–associated domains. Nat Genet. 2011;44:40–46. - PMC - PubMed
    1. Challen GA, Sun D, Jeong M, Luo M, Jelinek J, Berg JS, Bock C, Vasanthakumar A, Gu H, Xi Y, et al. Dnmt3a is essential for hematopoietic stem cell differentiation. Nat. Genet. 2011;44:23–31. - PMC - PubMed
    1. Chen T, Ueda Y, Dodge JE, Wang Z, Li E. Establishment and Maintenance of Genomic Methylation Patterns in Mouse Embryonic Stem Cells by Dnmt3a and Dnmt3b. Mol Cell Biol. 2003;23:5594–5605. - PMC - PubMed
    1. Crooks GE, Hon G, Chandonia J-M, Brenner SE. WebLogo: a sequence logo generator. Genome Research. 2004;14:1188–1190. - PMC - PubMed

Publication types

Substances