. 2014 Apr 14;25(4):455-68.
doi: 10.1016/j.ccr.2014.02.007. Epub 2014 Mar 20.

SPOP promotes tumorigenesis by acting as a key regulatory hub in kidney cancer

Affiliations

SPOP promotes tumorigenesis by acting as a key regulatory hub in kidney cancer

Guoqiang Li et al. Cancer Cell. .

Abstract

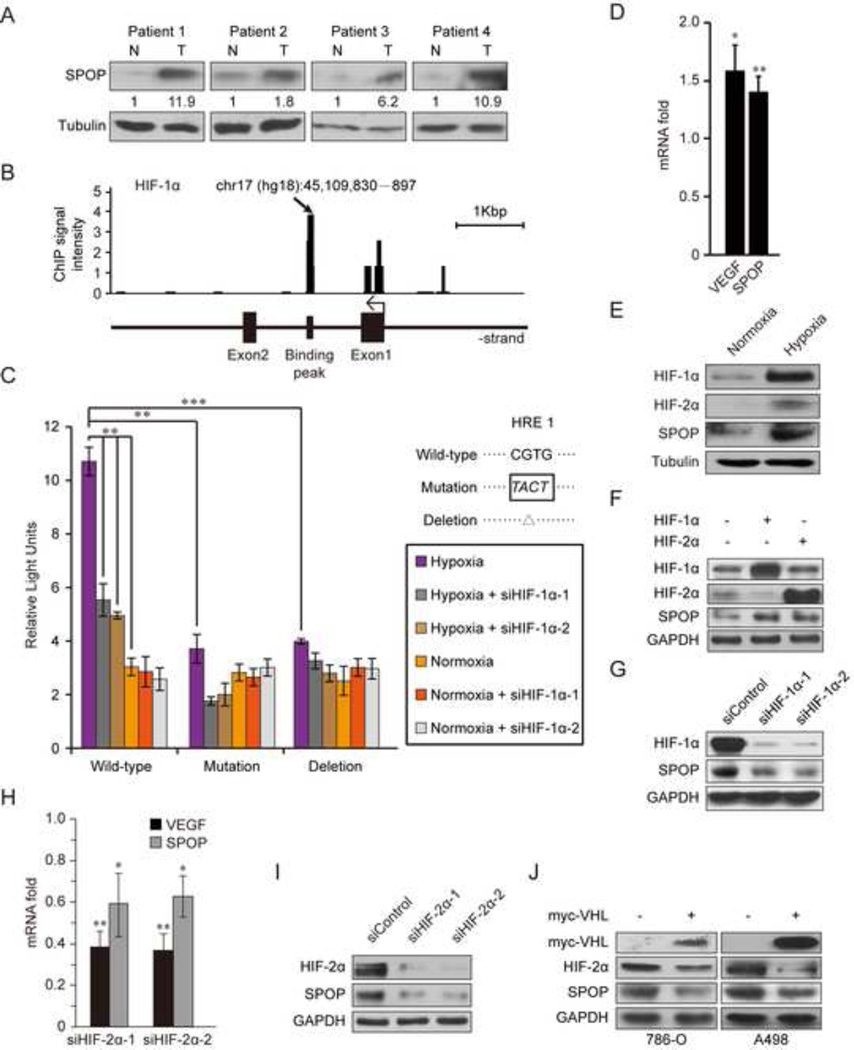
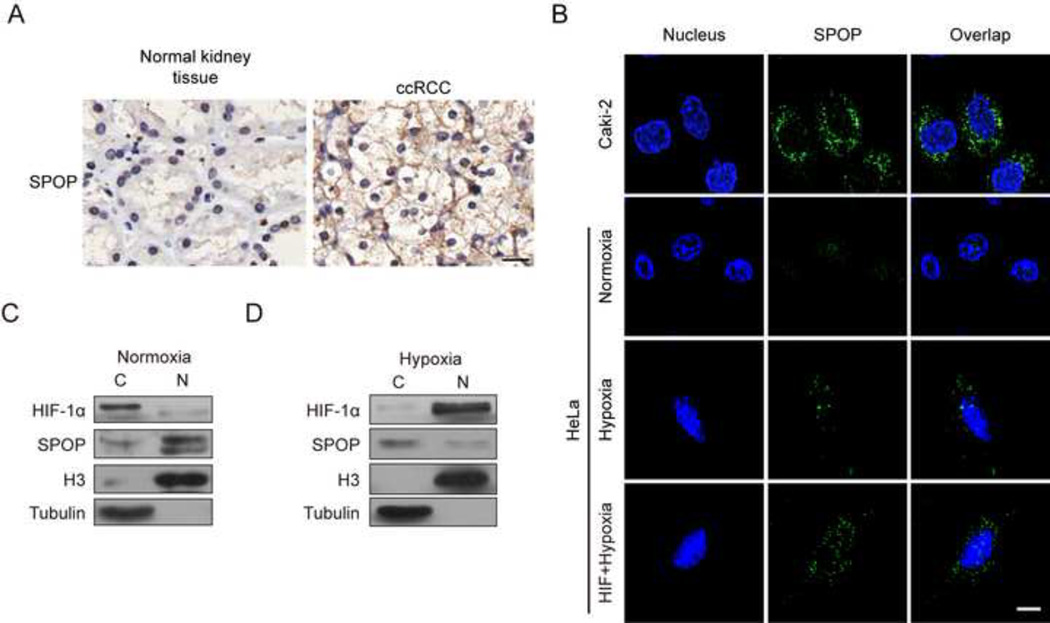
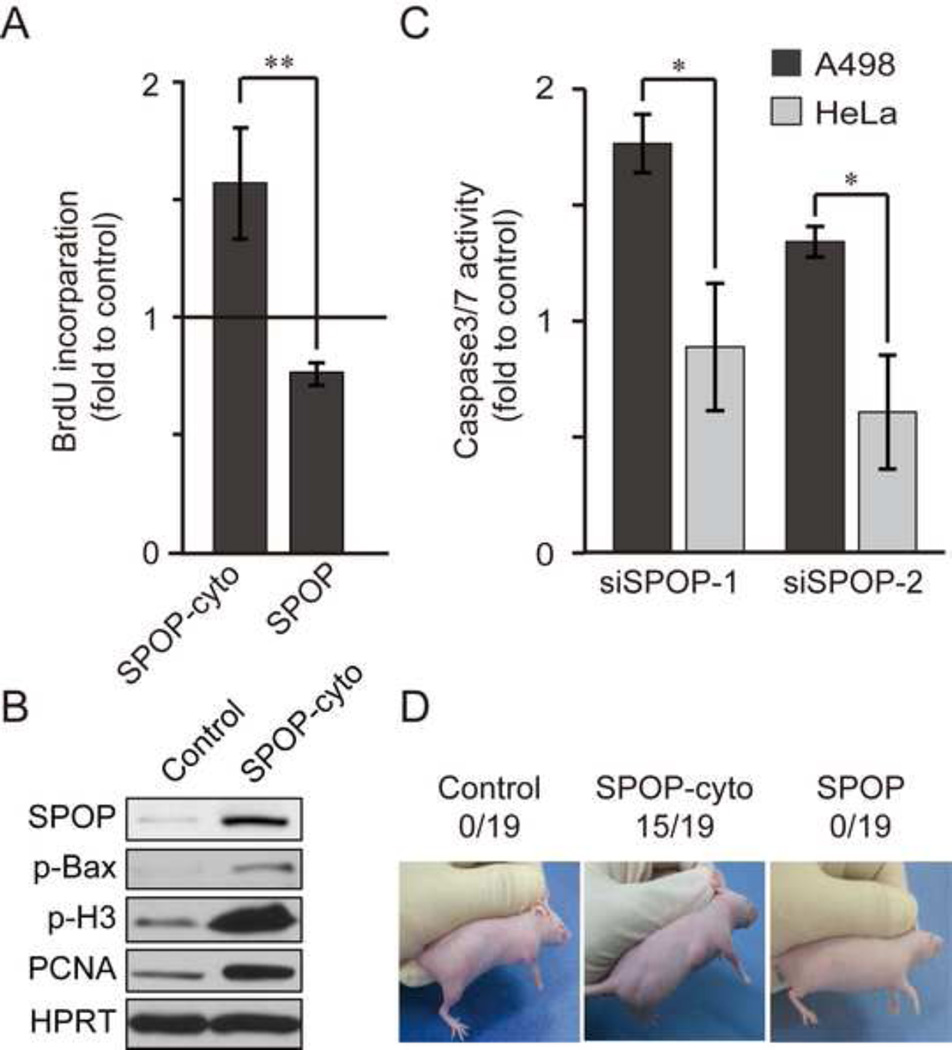
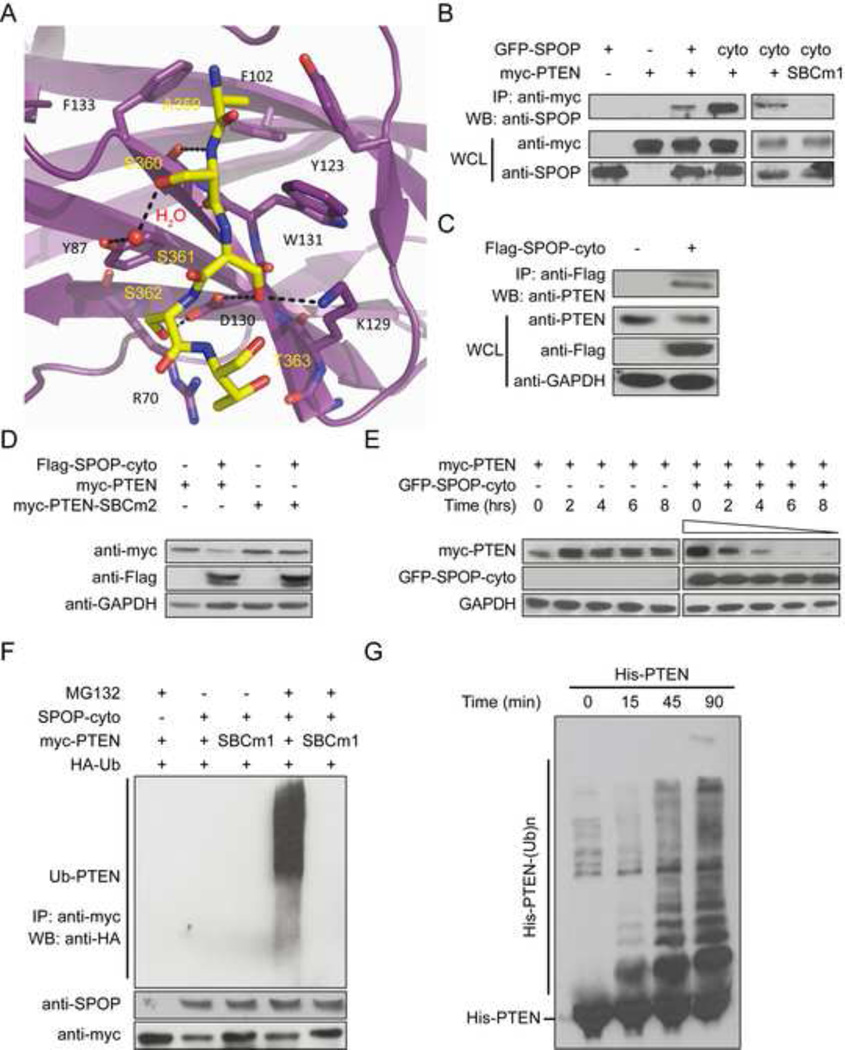
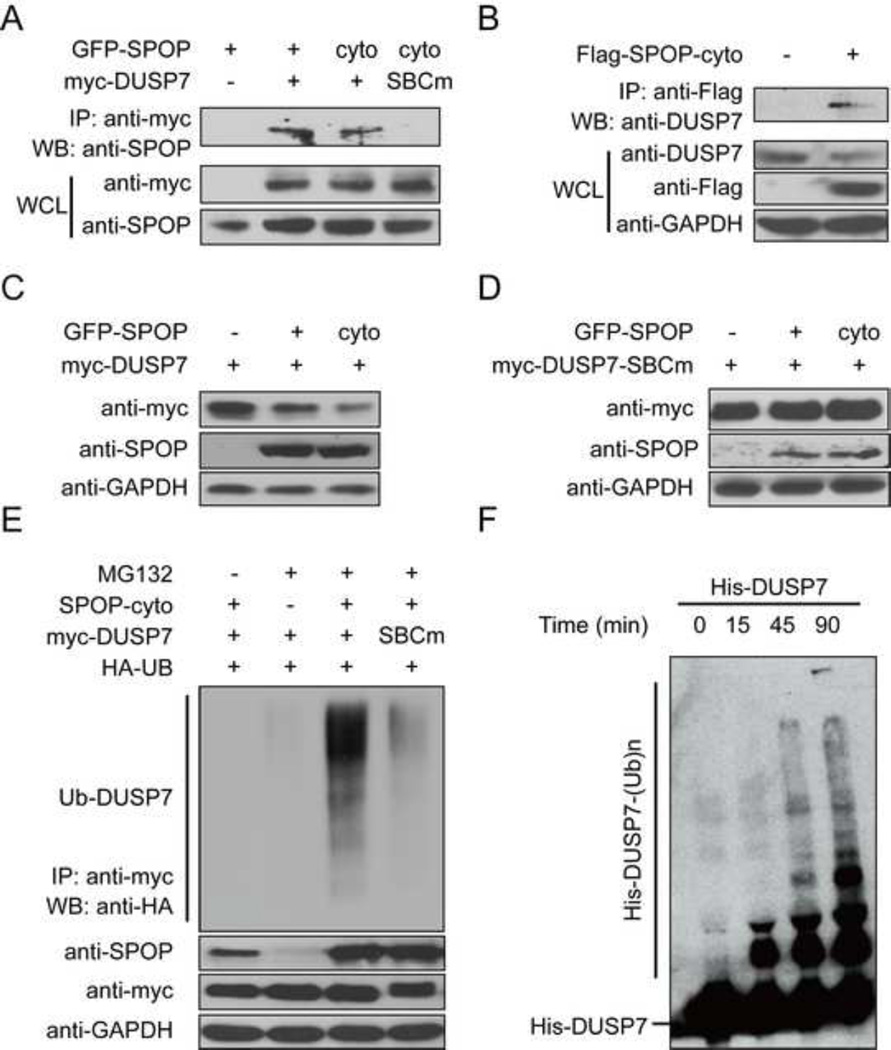
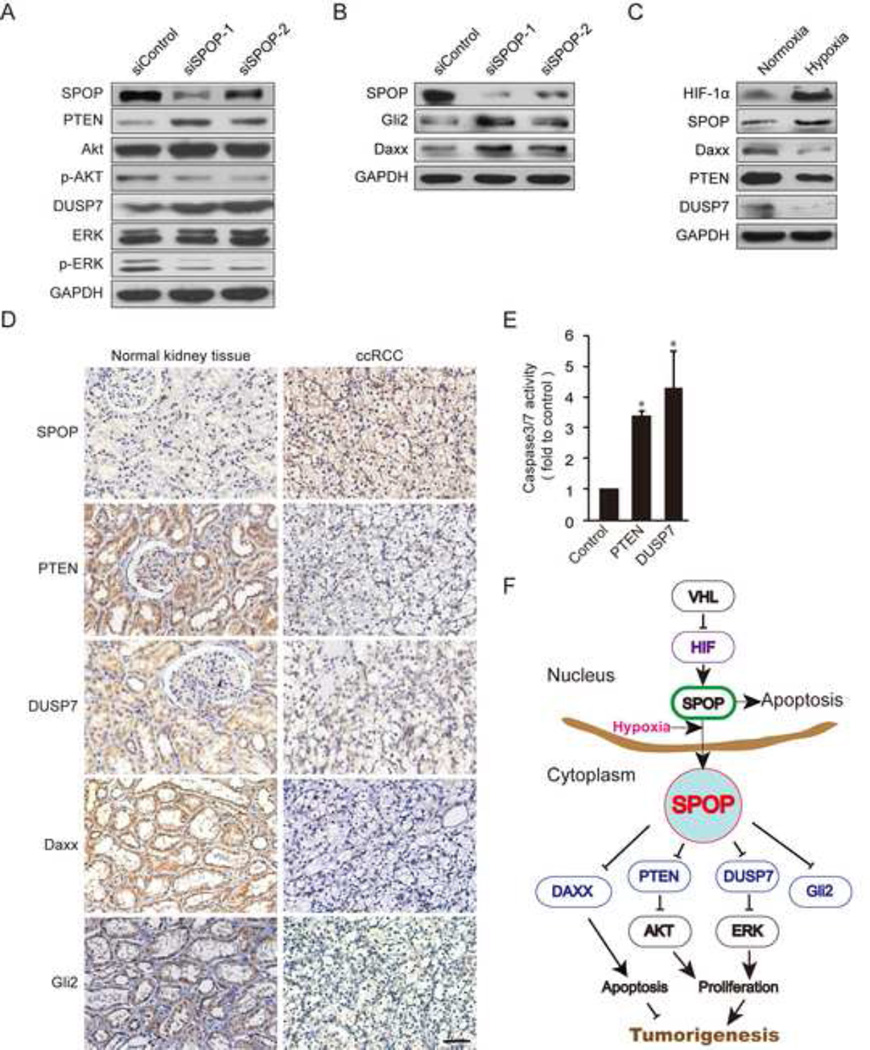
Hypoxic stress and hypoxia-inducible factors (HIFs) play important roles in a wide range of tumors. We demonstrate that SPOP, which encodes an E3 ubiquitin ligase component, is a direct transcriptional target of HIFs in clear cell renal cell carcinoma (ccRCC). Furthermore, hypoxia results in cytoplasmic accumulation of SPOP, which is sufficient to induce tumorigenesis. This tumorigenic activity occurs through the ubiquitination and degradation of multiple regulators of cellular proliferation and apoptosis, including the tumor suppressor PTEN, ERK phosphatases, the proapoptotic molecule Daxx, and the Hedgehog pathway transcription factor Gli2. Knockdown of SPOP specifically kills ccRCC cells, indicating that it may be a promising therapeutic target. Collectively, our results indicate that SPOP serves as a regulatory hub to promote ccRCC tumorigenesis.


Figures

Figure 1
Figure 1. HIF activates SPOP expression
(A) Immunoblots of endogenous SPOP in four paired ccRCC tumor and adjacent non-tumor tissue samples. Numbers indicate the relative density of the tumor tissue verse normal tissue as evaluated using Image J software. SPOP was detected by immunoblotting with an anti-SPOP antibody (clone 6C). Tubulin was used as a loading control. (B) HIF-1α ChIP-seq peak within the first intron of the SPOP gene (arrow). ChIP signal intensity represents differential binding between input/mock IP control and HIF-1α antibody ChIP. The ChIP signal intensity represents the differential binding. (C) Luciferase reporter assays indicate that the HIF binding peak in the first intron of SPOP (chr17: 45,032,738–890) is functional. The wild-type and HRE (CGTG) mutated or deleted HIF binding sequence were cloned into a pGL3-promoter vector. Luciferase activities were normalized to Renella luciferase, and the results are represented as values relative to the empty vector. Hypoxia was induced using a hypoxia chamber (1% O2/5% CO2/94% N2). RNAi knockdown was performed with two independent siRNAs to HIF-1α. (D) SPOP mRNA expression is activated under hypoxic conditions in the Caki-2 ccRCC cell line. VEGF was used as a positive control. (E) SPOP protein abundance increases after hypoxia treatment in Caki-2 cells. Tubulin was used as a loading control. (F) In either HIF-1α- or HIF-2α-transfected HEK293 cells, SPOP protein expression was induced. GAPDH was used as a loading control. (G) Knockdown HIF-1α down-regulated the expression of SPOP in Caki-2 cells. RNAi knockdown was performed as Figure 1C. (H) SPOP mRNA expression is suppressed after two independent siRNAs knockdown of HIF-2α in 786-O ccRCC cells. mRNA expression was normalized to control cells exposed to negative control siRNAs. VEGF was used as a positive control. (I) SPOP protein abundance decreases after knockdown of HIF-2α in A498 cells. Tubulin was used as a loading control. (J) SPOP protein abundance decreases when restoring of VHL in 786-O and A498 cells. Cells were harvested 72 hr after transfection. GAPDH was used as a loading control. Data in (C), (D), and (H) are presented as mean ± SD of at least three independent experiments. *p < 0.05, **p < 0.01 and ***p < 0.001 based on Student’s t test. See also Figure S1.
Figure 2
Figure 2. Hypoxia drives SPOP accumulation in the cytoplasm of ccRCC cells
(A) Immunohistochemistry reveals that SPOP accumulates in the cytoplasm of ccRCC tumor cells but in the nuclei of adjacent non-tumor cells. An SPOP-specific monoclonal antibody (SPOP-5G) was used for staining (diaminobenzidine, brown staining). Scale bar, 20µm. (B) SPOP localizes in the nucleus in HeLa cells under normoxic conditions but accumulates in the cytoplasm under hypoxic conditions (1% O2), comparable to that in Caki-2 cells; additional HIF expression enhances SPOP accumulation in the cytoplasm. Cells were stained with SPOP-5G antibody (green), and the nuclei were counterstained with DAPI (4', 6-diamidino-2-phenylindole, blue). Scale bar, 10µm. (C) Separation of the nuclear (N) and cytoplasmic (C) fractions confirms SPOP accumulation in the cytoplasm of HeLa cells under mormoxic conditions. Histone H3 and tubulin served as nuclear and cytoplasmic markers, respectively. (D) Separation of the nuclear (N) and cytoplasmic (C) fractions confirms SPOP accumulation in the cytoplasm of HeLa cells under hypoxic conditions (1% O2). Histone H3 and tubulin served as nuclear and cytoplasmic markers, respectively. See also Figure S2.
Figure 3
Figure 3. Cytoplasmic SPOP promotes tumorigenesis
(A) SPOP-cyto promotes cell proliferation. HEK293 cells were transfected with the indicated vectors for 48 hr, and cell proliferation was measured by BrdU incorporation. Values are normalized to empty vector-transfected control cells. (B)SPOP-cyto overexpression upregulates the indicated anti-apoptotic marker ser184-phosphorylated Bax (p-Bax) and proliferation markers, ser10-phosphorylated histone H3 (p-Histone H3) and Proliferating Cell Nuclear Antigen (PCNA). SPOP-5G antibody was used to blot SPOP. HPRT served as a loading control. (C) RNAi knockdown of SPOP induces apoptosis in A498 but not HeLa cells. Apoptosis was evaluated by caspase 3/7 activity 48 h after siRNA transfection. (D) SPOP-cyto promotes tumorigenesis in a xenograft model. HEK293-pcDNA3, HEK293-SPOP or HEK293-SPOP-cyto polyclonal stable cell lines were injected subcutaneously into the nude mice. Six weeks later, the number of mice that formed tumors in each group was counted. Data in (A) and (C) are presented as the mean ± SD of three independent experiments. *p < 0.05 and **p < 0.01 based on Student’s t test. See also Figure S3.
Figure 4
Figure 4. SPOP mediates the ubiquitination and degradation of PTEN
(A) Crystal structure of the SPOP MATH domain complex with a peptide corresponding to the PTEN SBC motif. (B) Co-immunoprecipitation reveals that SPOP and SPOP-cyto bind PTEN, whereas a PTEN mutant lacking a functional SBC motif (SBC1, deletion of the SBC peptide residues 359–363) is unable to bind SPOP. HeLa cells were transfected with the indicated plasmids and incubated with 10 µM MG132 for 4 hours before harvesting. GFP-SPOP and GFP-SPOP-cyto were detected with monoclonal antibody SPOP-6C.WCL represents whole cell lysates. (C) Co-immunoprecipitation and immunoblots indicate that overexpressed SPOP-cyto can interact with and degrade endogenous PTEN in HeLa cells. GAPDH served as a loading control. WCL represents whole cell lysates. (D) SPOP promotes the degradation of PTEN but not a PTEN SBC mutant (SBC2: the SBC motif ASSST was replaced with GGSGG). GAPDH was used as a loading control. (E) Measurement of PTEN protein abundance by cycloheximide (CHX) chase assay. HEK293 cells were transfected with the indicated plasmids. Thirty-six hours after transfection, the cells were treated with CHX (100 µg/ml) for 2–8 h, and western blotting was performed. GFP-SPOP-cyto was detected with monoclonal antibody SPOP-6C. GAPDH was used as a loading control. (F) Knockdown of SPOP by siRNA induces PTEN protein accumulation and increased phospho-Akt (Thr308) levels in A498 cells. SPOP was detected with monoclonal antibody SPOP-6C. (F) In vivo ubiquitination assay reveals that SPOP promotes PTEN ubiquitination through the PTEN SBC domain. Cell lysates were prepared under denaturing conditions. Myc-PTEN was immunoprecipitated and HA-Ub was detected by immunoblot. (G) In vitro ubiquitination assay demonstrates that PTEN is a substrate of SPOP. See also Table S1 and Figure S4.
Figure 5
Figure 5. SPOP mediates the ubiquitination and degradation of DUSP7
(A) Ectopically expressed SPOP or SPOP-cyto can interact with DUSP7 in an in vivo co-immunoprecipitation (co-IP) assay, whereas DUSP7-SBCm (replace SBC motif VDSSS with VDGGG) eliminates the interaction. HeLa cells were transfected with the indicated constructs and incubated with 10 µM MG132 for 4 hours before harvesting. (B) Co-immunoprecipitation and immunoblots indicate that overexpressed SPOP-cyto can interact and degrade endogenous DUSP7 in HeLa cells. GAPDH served as a loading control. (C) SPOP promotes DUSP7 degradation. HEK293 cells were transfected with the indicated constructs. GFP-SPOP and GFP-SPOP-cyto were detected with monoclonal antibody SPOP-6C. GAPDH was used as loading control. (D) Immunoblots demonstrate that neither SPOP nor SPOP-cyto can degrade DUSP7-SBCm. (E) In vivo ubiquitination assay reveals that SPOP promotes DUSP7 ubiquitination through the DUSP7 SBC domain. Cell lysates were prepared under denaturing condition. Myc-DUSP7 was immunoprecipitated, and HA-Ub was detected by immunoblotting. (F) In vitro ubiquitination assay demonstrates that DUSP7 is a substrate of SPOP. See also Figure S5.
Figure 6
Figure 6. SPOP regulates multiple targets in kidney cancer
(A) Immunoblots indicate that knockdown of SPOP induces PTEN and DUSP7 protein accumulation and decreased phosphor-Akt (Thr308) and phospho-ERK (Thr202/Tyr204) levels in A498 cells. GAPDH served as a loading control. (B) Immunoblots demonstrate that knockdown of SPOP in Caki-2 cells induced Daxx and Gli2 protein accumulation. GAPDH was used as loading control. (C) Daxx, PTEN and DUSP7 protein abundance decrease under hypoxia treatment in HeLa cells. (D) Immunohistochemistry staining indicates a reduction in multiple SPOP targets, PTEN, DUSP7, Daxx and, in ccRCCs patient samples compared with their adjacent normal tissues (diaminobenzidine, brown staining). One pair of representative samples is shown. Scale bar, 50µm. (E) Restoring of PTEN and DUSP7 induces apoptosis in A498. Caspase 3/7 activity was analyzed to evaluate cell apoptosis. Values were normalized to control and expressed as mean ± SD of three independent experiments. *p < 0.05 based on Student’s t test. (F) Schematic overview of SPOP action as a regulatory hub in promoting tumorigenesis in ccRCC. Although SPOP is localized to the nucleus in normal cells, in cancer cells it accumulates in the cytoplasm and promotes tumorigenesis by targeting tumor suppressor (PTEN, DUSP7, Gli2) and pro-apototic protein (Daxx) for ubiquitin-mediated degradation. See also Figure S6.

Similar articles

Cited by

References

    1. Arimoto K, Fukuda H, Imajoh-Ohmi S, Saito H, Takekawa M. Formation of stress granules inhibits apoptosis by suppressing stress-responsive MAPK pathways. Nat Cell Biol. 2008;10:1324–1332. - PubMed
    1. Berger MF, Lawrence MS, Demichelis F, Drier Y, Cibulskis K, Sivachenko AY, Sboner A, Esgueva R, Pflueger D, Sougnez C, et al. The genomic complexity of primary human prostate cancer. Nature. 2011;470:214–220. - PMC - PubMed
    1. Bhatia B, Hsieh M, Kenney AM, Nahle Z. Mitogenic Sonic hedgehog signaling drives E2F1-dependent lipogenesis in progenitor cells and medulloblastoma. Oncogene. 2011;30:410–422. - PMC - PubMed
    1. Brenner W, Farber G, Herget T, Lehr HA, Hengstler JG, Thuroff JW. Loss of tumor suppressor protein PTEN during renal carcinogenesis. Int J Cancer. 2002;99:53–57. - PubMed
    1. Brugarolas J. Renal-Cell Carcinoma — Molecular Pathways and Therapies. New England Journal of Medicine. 2007;356:185–187. - PubMed

Publication types

MeSH terms

Associated data