. 2014 Apr 10;7(1):269-80.
doi: 10.1016/j.celrep.2014.02.030. Epub 2014 Mar 20.

Cell-type-specific circuit connectivity of hippocampal CA1 revealed through Cre-dependent rabies tracing

Affiliations

Cell-type-specific circuit connectivity of hippocampal CA1 revealed through Cre-dependent rabies tracing

Yanjun Sun et al. Cell Rep. .

Abstract

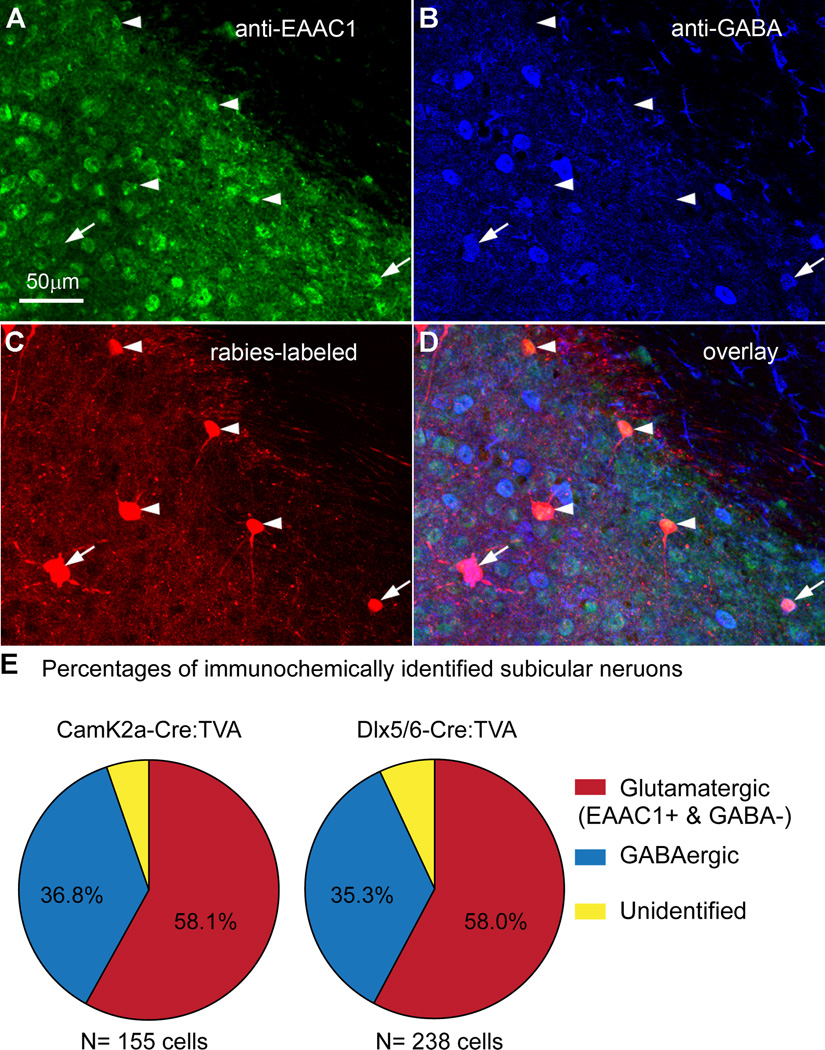
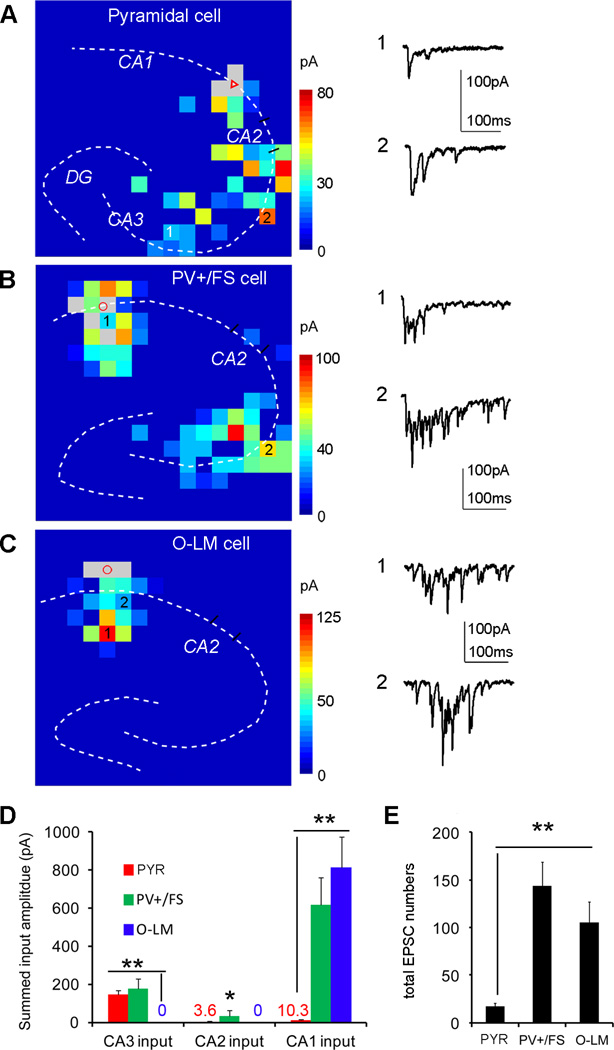
We developed and applied a Cre-dependent, genetically modified rabies-based tracing system to map direct synaptic connections to specific CA1 neuron types in the mouse hippocampus. We found common inputs to excitatory and inhibitory CA1 neurons from CA3, CA2, the entorhinal cortex (EC), the medial septum (MS), and, unexpectedly, the subiculum. Excitatory CA1 neurons receive inputs from both cholinergic and GABAergic MS neurons, whereas inhibitory neurons receive a great majority of inputs from GABAergic MS neurons. Both cell types also receive weaker input from glutamatergic MS neurons. Comparisons of inputs to CA1 PV+ interneurons versus SOM+ interneurons showed similar strengths of input from the subiculum, but PV+ interneurons received much stronger input than SOM+ neurons from CA3, the EC, and the MS. Thus, rabies tracing identifies hippocampal circuit connections and maps how the different input sources to CA1 are distributed with different strengths on each of its constituent cell types.


Figures

Figure 1
Figure 1. Cre-dependent rabies tracing approach
(A) A mouse transgenic line that expresses Cre in specific type/group of hippocampal neurons is first crossed with the Cre-dependent TVA expressing mouse line, LSL-R26TVA-lacZ (Seidler et al., 2008) to target gene expression and control initial rabies virus infection. (B) The AAV helper virus and EnvA pseudotyped G-deleted rabies virus are used for circuit tracing. Using the AAV8-pEF1α-FLEX-HB (H: nuclear localized histone GFP; B: B19 rabies glycoprotein, RG), the initial AAV injection (0.1 µL, spatially restricted in CA1) allows for expression of RG and GFP transgenes after Cre-recombinase mediated activity in Cre-expressing neurons. The second injection delivers 0.1 µL EnvA-SADΔG-mCherry (ΔG: RG deleted, mCherry: a red fluorescent protein) into the same location of the previous AAV injection. (C) Timeline of viral injections and schematic illustration of rabies-mediated monosynaptic retrograde labeling. Green indicates GFP expression from the helper AAV genome, labeling the rabies receptive target cells while red indicates mCherry expression from SADΔG-mCherry rabies genome in the target cells (starter cells) and their first-order presynaptic neurons. The starter cells are identified as GFP and mCherry double-labeled. At 9 days after the rabies injection, the animal is perfused with 4% paraformaldehyde and the brain extracted for histological processing.
Figure 2
Figure 2. Rabies labeling of presynaptic neurons shows direct local and more distant circuit connections to CA1 excitatory pyramidal cells in Camk2a-Cre: TVA mouse hippocampus
(A–B) Ipsilateral and contralateral hippocampal images of the viral injection site. Strong rabies-mediated labeling of putative excitatory neurons is seen in both ipsilateral and contralateral CA3. Local CA1 inhibitory neurons outside stratum pyramidale are also labeled. (C–D) An enlarged view of the white box in A, with GFP and DAPI overlay in C showing restricted AAV-mediated infection and gene expression in stratum pyramidale, and with GFP and mCherry overlay in D showing the GFP-mCherry double labeled starter cells (indicated by the arrows in C and D). (E–J). Rabies-labeled (mCherry-expressing) presynaptic neurons (distant from the injection site) are seen in the subiculum, the medial septum and diagonal band (MS-DB) area, and entorhinal cortex, respectively. F and G show the enlarged view of the two white-boxed regions in E, while J shows the enlarged view of the white-boxed region in I. AP numbers indicate the positions of the coronal sections relative to the bregma landmark.
Figure 3
Figure 3. CA1 inhibitory neurons targeted using the Dlx5/6-Cre: TVA mouse and CA1 excitatory pyramidal cells have similar patterns of input circuit connections
(A–B) Ipsilateral and contralateral hippocampal images close to the viral injection site. Rabies-mediated labeling of putative excitatory neurons is seen in both ipsilateral and contralateral CA3, as well as in CA2 in these sections. (C–D) An enlarged view of a section at the injection site (AP: −1.94 mm), showing DAPI staining and GFP expression from the helper AAV both in and outside stratum pyramidale in C, and with the GFP and mCherry overlay in D showing the GFP-mCherry double labeled starter cells (indicated by the arrows in C and D). (E–G). Rabies-labeled presynaptic neurons in the subiculum, the medial septum and diagonal band area, and entorhinal cortex, respectively. H shows the enlarged view of the white-boxed region in G.
Figure 4
Figure 4. Immunochemical characterization and quantification of rabies-labeled CA1-projecting subicular neurons
(A–D) Immunostaining of excitatory amino acid transporter type1 (EAAC1) and GABA in brain slices with rabies-labeled subicular neurons from a Camk2-Cre: TVA case, in which the immunoreactivity of EAAC1, GABA and rabies mCherry expression is shown in green, blue (pseudocolor from AF647-conjugated secondary antibody), red, respectively. For the rabies-labeled neurons, the arrows point at subicular GABAergic neurons (GABA+) while glutamatergic neurons (EAAC1+ and GABA−) are pointed at by the arrowheads. Note that many GABAergic neurons also show strong EAAC1 staining (Conti et al., 1998). (E) Quantification of rabies-labeled, immunochemically identified subicular glutamatergic (excitatory) neurons and GABAergic inhibitory neurons. There are a small percentage of rabies labeled cells that were neurochemically unidentified, as they did not show robust staining against EAAC1 or GABA.
Figure 5
Figure 5. Neurochemical characterization and quantification of rabies-labeled neurons in medial septum and diagonal band of broca complex (MS-DB) presynaptic to CA1 excitatory and inhibitory neurons
(A) Immunostaining of choline acetyltransferase (ChAT) in brain slices with rabies-labeled medial septum neurons from Camk2a-Cre: TVA case to identify septal cholinergic neurons. (B–D) Enlarged view of the region indicated by the white box in A which immunoreactivity of ChAT shows in green, and rabies mCherry shows in red. Arrows point at medial septum cholinergic neurons labeled by rabies virus. (E) Immunostaining of EAAC1 and GABA in brain slices with rabies-labeled medial septum neurons from Dlx5/6-Cre: TVA case to identify septal GABAergic and glutamatergic neurons. (F–I) Enlarged view of the region indicated by the white box in E. The immunoreactivity of EAAC1, GABA and rabies mCherry expression is shown in green, blue (pseudocolor from AF647-conjugated secondary antibody), red, respectively. For rabies-labeled neurons, the arrows point at medial septum GABAergic neurons (GABA+), while glutamatergic neurons (EAAC1+ and GABA−) are pointed at by the arrowheads. (J–K) Quantification of rabies-labeled, immunochemically identified MS-DB cholinergic, GABAergic, and glutamatergic neurons in both Camk2-Cre: TVA and Dlx5/6-Cre: TVA cases.
Figure 6
Figure 6. Comparison of circuit input connections between parvalbumin-expressing (PV+) inhibitory neurons and somatostatin-expressing (SOM+) inhibitory neurons
PV+ cells are targeted using the PV-Cre: TVA mouse, while SOM+ cells are targeted using the SOM-Cre: TVA mouse. (A–B) A PV-Cre: TVA case. Ipsilateral and contralateral hippocampal images close to the viral injection site. Rabies-mediated labeling of putative excitatory neurons is seen in both ipsilateral and contralateral CA3, as well as in contralateral CA1 in the section. (C–D) A SOM-Cre: TVA case. Ipsilateral and contralateral hippocampal images around the viral injection site. Rabies labeling is predominately found throughout ipsilateral CA1, while no or little labeling is found in contralateral hippocampus. Rabies-mediated labeling of putative excitatory neurons is seen in stratum pyramidale of ipsilateral CA1. (E–F) Examples from the PV-Cre: TVA case. Rabies-labeled presynaptic neurons in the medial septum and diagonal band area, and entorhinal cortex, respectively. (G–H) The enlarged view of the two white-boxed regions in F. (I–J). Examples from the SOM-Cre:TVA case. Rabies-labeled presynaptic neurons in the medial septum and diagonal band area, and the subiculum, respectively. (K–L) The enlarged view of the two white-boxed regions in G. Note that there is no or little labeling in entorhinal cortex.
Figure 7
Figure 7. Laser scanning photostimulation (LSPS) mapping functionally verifies rabies tracing in identifying cell-type specific differences of intra-hippocampal circuit connections
(A) A color-coded, averaged input map (with each square corresponding to one stimulation site) superimposed with the hippocampal contour, illustrating the pattern and strength of synaptic inputs to a recorded excitatory pyramidal neuron in CA1. Its somatic location is indicated by the red triangle. The grey squares indicate the removal of direct responses from these sites. For the scale of input amplitudes, the warmer color indicates stronger amplitude. The grey squares indicate the removal of direct responses from these sites (see the Supplemental Method). The numbered sites correspond to the illustrated photostimulation response traces plotting from the onset of photostimulation. (B) A color-coded, averaged input map, illustrating the pattern and strength of synaptic inputs to an example PV+/FS inhibitory cell in CA1. (C) A color-coded, averaged input map, illustrating the pattern and strength of synaptic inputs to an example SOM+ O-LM inhibitory cell in CA1. (D) Summary data showing input strength differences across CA3, CA2 and CA1 to targeted pyramidal cells (PYR) (N = 7), PV+/FS inhibitory cells (N = 8) and O-LM inhibitory cells (N = 7). As for CA3 excitatory inputs, the average total input amplitudes of pyramidal cells and PV+/FS inhibitory cells did not differ from each other, but these cell types differed significantly from O-LM cells. PV+/FS inhibitory cells had stronger CA2 inputs than either pyramidal cells or O-LM cells. As for CA1 excitatory inputs, PV+/FS and O-LM inhibitory cells did not differ from each other, but these cell types differed significantly from pyramidal cells. * and ** indicate the statistical significance levels of p < 0.05 and 0.01, respectively, for statistical comparisons. (E) Summary data showing average total EPSC events per cell measured from the records cells. PV+/FS and O-LM inhibitory cells did not differ from each other, but these cell types differed significantly from pyramidal cells.

References

    1. Ali AB, Thomson AM. Facilitating pyramid to horizontal oriens-alveus interneurone inputs: dual intracellular recordings in slices of rat hippocampus. J Physiol. 1998;507(Pt 1):185–199. - PMC - PubMed
    1. Amaral DG, Witter MP. The three-dimensional organization of the hippocampal formation: a review of anatomical data. Neuroscience. 1989;31:571–591. - PubMed
    1. Berger TW, Swanson GW, Milner TA, Lynch GS, Thompson RF. Reciprocal anatomical connections between hippocampus and subiculum in the rabbit evidence for subicular innervation of regio superior. Brain Res. 1980;183:265–276. - PubMed
    1. Blasco-Ibanez JM, Freund TF. Synaptic input of horizontal interneurons in stratum oriens of the hippocampal CA1 subfield: structural basis of feed-back activation. Eur J Neurosci. 1995;7:2170–2180. - PubMed
    1. Brivanlou IH, Dantzker JL, Stevens CF, Callaway EM. Topographic specificity of functional connections from hippocampal CA3 to CA1. Proc Natl Acad Sci U S A. 2004;101:2560–2565. - PMC - PubMed

Publication types