

Negative elongation factor controls energy homeostasis in cardiomyocytes
- PMID: 24656816
- PMCID: PMC4277258
- DOI: 10.1016/j.celrep.2014.02.028
Negative elongation factor controls energy homeostasis in cardiomyocytes
Abstract
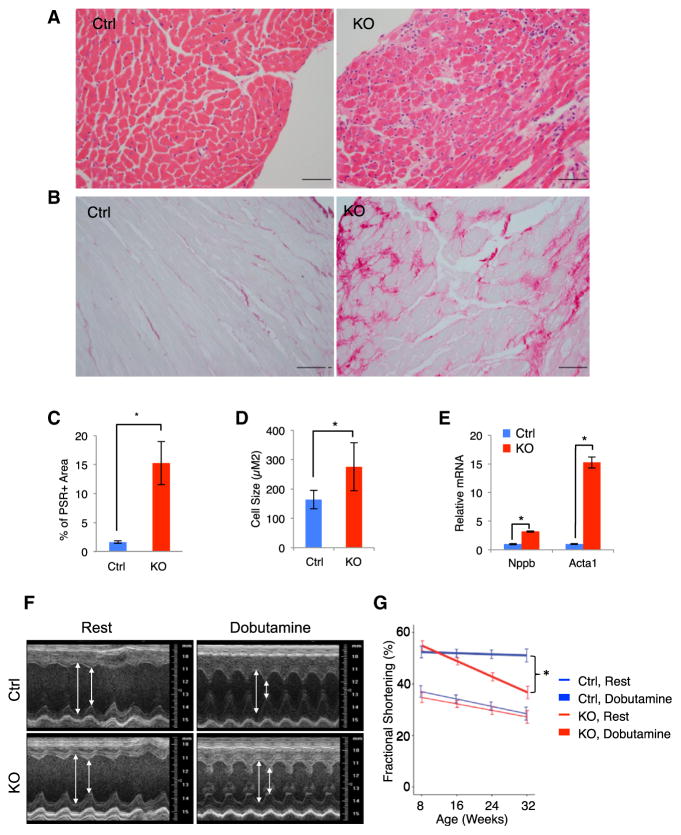
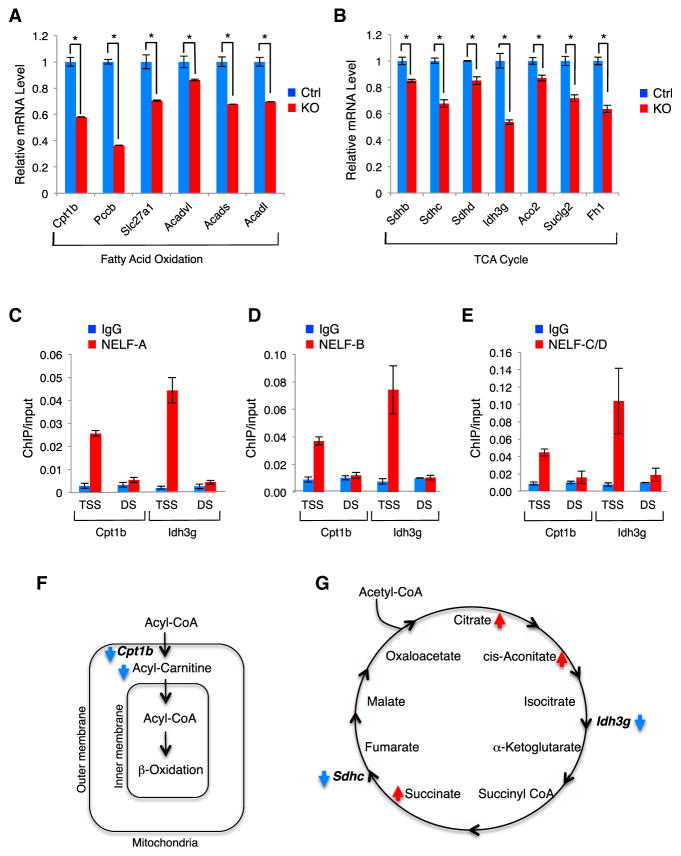
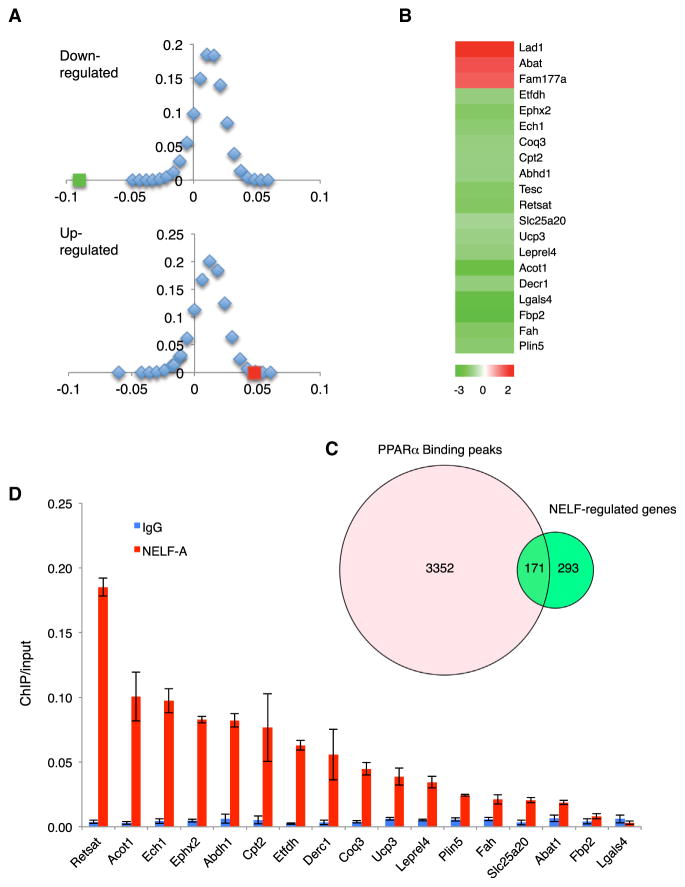
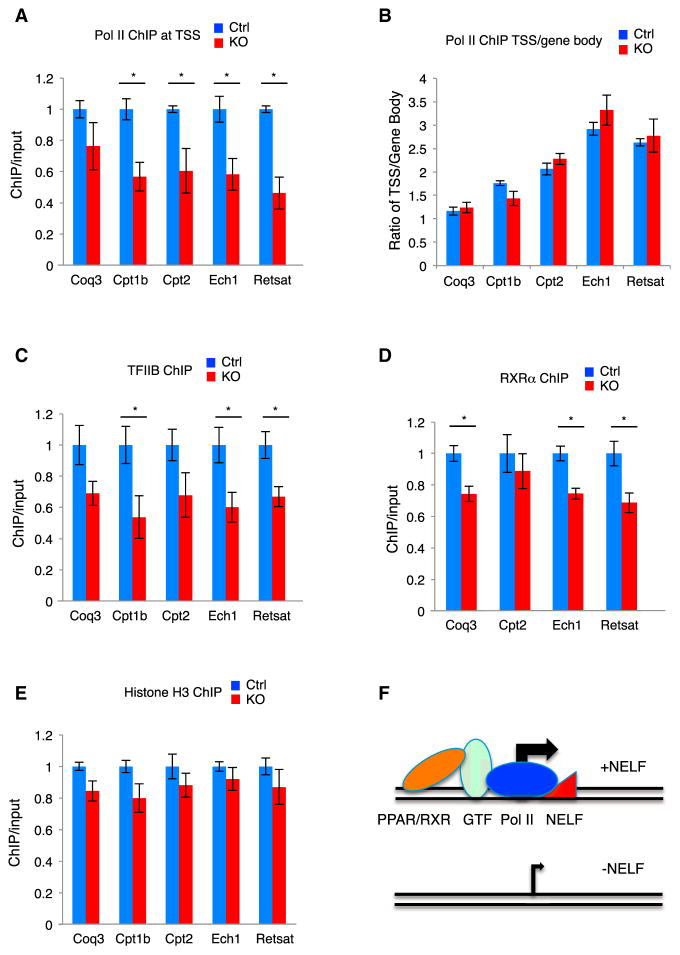
Negative elongation factor (NELF) is known to enforce promoter-proximal pausing of RNA polymerase II (Pol II), a pervasive phenomenon observed across multicellular genomes. However, the physiological impact of NELF on tissue homeostasis remains unclear. Here, we show that whole-body conditional deletion of the B subunit of NELF (NELF-B) in adult mice results in cardiomyopathy and impaired response to cardiac stress. Tissue-specific knockout of NELF-B confirms its cell-autonomous function in cardiomyocytes. NELF directly supports transcription of those genes encoding rate-limiting enzymes in fatty acid oxidation (FAO) and the tricarboxylic acid (TCA) cycle. NELF also shares extensively transcriptional target genes with peroxisome proliferator-activated receptor α (PPARα), a master regulator of energy metabolism in the myocardium. Mechanistically, NELF helps stabilize the transcription initiation complex at the metabolism-related genes. Our findings strongly indicate that NELF is part of the PPARα-mediated transcription regulatory network that maintains metabolic homeostasis in cardiomyocytes.
Copyright © 2014 The Authors. Published by Elsevier Inc. All rights reserved.
Figures
Similar articles
-
Distinct negative elongation factor conformations regulate RNA polymerase II promoter-proximal pausing.Mol Cell. 2024 Apr 4;84(7):1243-1256.e5. doi: 10.1016/j.molcel.2024.01.023. Epub 2024 Feb 23. Mol Cell. 2024. PMID: 38401543 Free PMC article.
-
Negative elongation factor (NELF) coordinates RNA polymerase II pausing, premature termination, and chromatin remodeling to regulate HIV transcription.J Biol Chem. 2013 Sep 6;288(36):25995-26003. doi: 10.1074/jbc.M113.496489. Epub 2013 Jul 24. J Biol Chem. 2013. PMID: 23884411 Free PMC article.
-
Genetic and genomic analyses of RNA polymerase II-pausing factor in regulation of mammalian transcription and cell growth.J Biol Chem. 2011 Oct 21;286(42):36248-57. doi: 10.1074/jbc.M111.269167. Epub 2011 Aug 24. J Biol Chem. 2011. PMID: 21865163 Free PMC article.
-
Regulation of Promoter Proximal Pausing of RNA Polymerase II in Metazoans.J Mol Biol. 2021 Jul 9;433(14):166897. doi: 10.1016/j.jmb.2021.166897. Epub 2021 Feb 25. J Mol Biol. 2021. PMID: 33640324 Free PMC article. Review.
-
PPAR signaling in the control of cardiac energy metabolism.Trends Cardiovasc Med. 2000 Aug;10(6):238-45. doi: 10.1016/s1050-1738(00)00077-3. Trends Cardiovasc Med. 2000. PMID: 11282301 Review.
Cited by
-
RNA polymerase II pausing factor NELF in CD8+ T cells promotes antitumor immunity.Nat Commun. 2022 Apr 20;13(1):2155. doi: 10.1038/s41467-022-29869-2. Nat Commun. 2022. PMID: 35444206 Free PMC article.
-
BET-ting on chromatin-based therapeutics for heart failure.J Mol Cell Cardiol. 2014 Sep;74:98-102. doi: 10.1016/j.yjmcc.2014.05.002. Epub 2014 May 14. J Mol Cell Cardiol. 2014. PMID: 24838003 Free PMC article. Review.
-
BRCA1-Dependent Transcriptional Regulation: Implication in Tissue-Specific Tumor Suppression.Cancers (Basel). 2018 Dec 14;10(12):513. doi: 10.3390/cancers10120513. Cancers (Basel). 2018. PMID: 30558184 Free PMC article. Review.
-
Analysis of Time-Series Gene Expression Data to Explore Mechanisms of Chemical-Induced Hepatic Steatosis Toxicity.Front Genet. 2018 Sep 18;9:396. doi: 10.3389/fgene.2018.00396. eCollection 2018. Front Genet. 2018. PMID: 30279702 Free PMC article.
-
Uncovering the cellular capacity for intensive and specific feedback self-control of the argonautes and MicroRNA targeting activity.Nucleic Acids Res. 2020 May 21;48(9):4681-4697. doi: 10.1093/nar/gkaa209. Nucleic Acids Res. 2020. PMID: 32297952 Free PMC article.
References
-
- Boergesen M, Pedersen TA, Gross B, van Heeringen SJ, Hagenbeek D, Bindesbøll C, Caron S, Lalloyer F, Steffensen KR, Nebb HI, et al. Genome-wide profiling of liver X receptor, retinoid X receptor, and peroxisome proliferator-activated receptor α in mouse liver reveals extensive sharing of binding sites. Mol Cell Biol. 2012;32:852–867. - PMC - PubMed
-
- Cahill TJ, Ashrafian H, Watkins H. Genetic cardiomyopathies causing heart failure. Circ Res. 2013;113:660–675. - PubMed
Publication types
MeSH terms
Substances
Associated data
- Actions
Grants and funding
LinkOut - more resources
Full Text Sources
Other Literature Sources
Molecular Biology Databases
