. 2014 Apr 10;7(1):127-37.
doi: 10.1016/j.celrep.2014.02.033. Epub 2014 Mar 20.

The number of fetal nephron progenitor cells limits ureteric branching and adult nephron endowment

Affiliations

The number of fetal nephron progenitor cells limits ureteric branching and adult nephron endowment

Cristina Cebrian et al. Cell Rep. .

Abstract

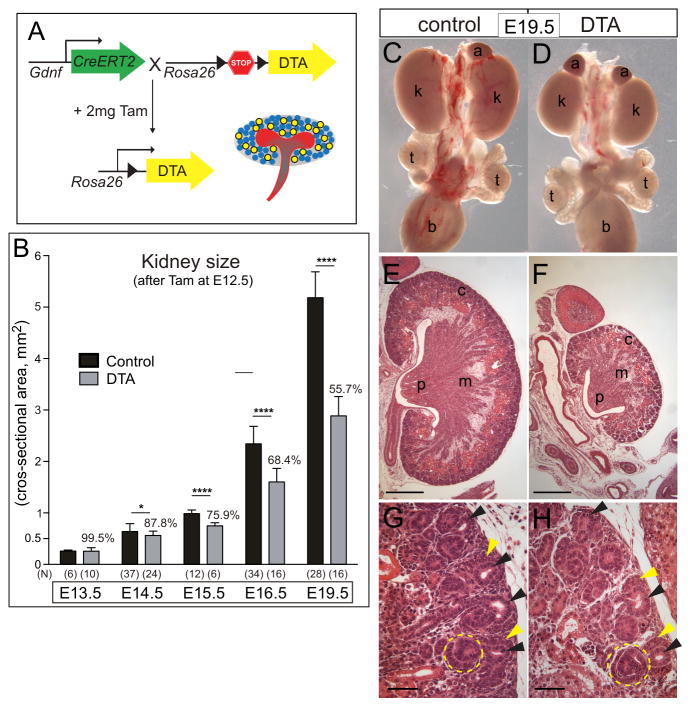
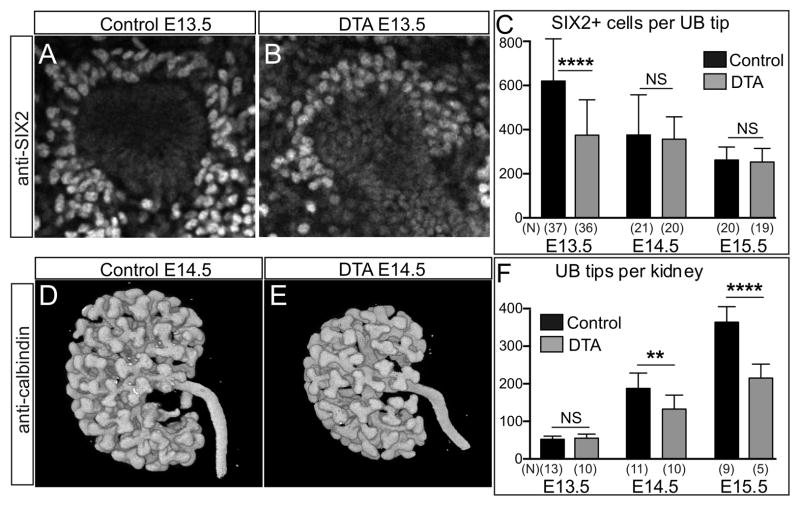
Nephrons, the functional units of the kidney, develop from progenitor cells (cap mesenchyme [CM]) surrounding the epithelial ureteric bud (UB) tips. Reciprocal signaling between UB and CM induces nephrogenesis and UB branching. Although low nephron number is implicated in hypertension and renal disease, the mechanisms that determine nephron number are obscure. To test the importance of nephron progenitor cell number, we genetically ablated 40% of these cells, asking whether this would limit kidney size and nephron number or whether compensatory mechanisms would allow the developing organ to recover. The reduction in CM cell number decreased the rate of branching, which in turn allowed the number of CM cells per UB tip to normalize, revealing a self-correction mechanism. However, the retarded UB branching impaired kidney growth, leaving a permanent nephron deficit. Thus, the number of fetal nephron progenitor cells is an important determinant of nephron endowment, largely via its effect on UB branching.


Figures

Figure 1
Figure 1. Construction and validation of a GdnfCreERT2 mouse strain
(A) β-galactosidase staining of a kidney from an E12.5 GdnfLacZ/+ embryo after 12 hrs in culture. Asterisks (in A, D and E) indicate the position of the ureteric bud. (B) Schematic diagram of gene targeting strategy; see Experimental Procedures for details. Note that the DT-A gene in the targeting vector is only used for negative selection and is not present in the targeted allele. (C) Histogram of kidney size (maximal cross-sectional area) in newborn wild-type mice, GdnfLacZ (null allele) heterozygotes, and heterozygotes or homozygotes for the GdnfCreERT2 allele. **** P<0.0001. NS, not significant. (D–E) YFP expression in E12.5 GdnfCreERT2/+; R26RYFP/YFP kidneys, cultured with 10nM 4OHT in the medium for 16 or 40 hrs, respectively, showing YFP expression in the metanephric mesenchyme surrounding the unlabeled ureteric bud. No YFP expression was observed in vehicle treated kidneys or in those lacking the GdnfCreERT2 allele (data not shown). Scale bar 400μm. A time-lapse movie of a similar culture is shown in Movie S1.
Figure 2
Figure 2. Gdnf is expressed by multipotent nephron progenitors with capacity for self-renewal
(A) Strategy for labeling Gdnf-expressing cells and their descendants. GdnfCreERT2/+ mice were crossed to R26RYFP/YFP mice and recombination was induced by intraperitoneal injection of 2 mg tamoxifen (Tam) at E10.5. This resulted in YFP labeling of a fraction of MM cells by ~E11.5 (green dots in kidney diagram). (B–I) immunofluorescence imaging of thin frozen kidney sections at E17.5 with antibodies against renal markers in red, and YFP-positive, Gdnf-lineage cells in green. (B–C) Anti-Calbindin antibodies detect ureteric bud (ub). (D) Anti-Six2 antibodies detect nephrogenic (i.e., cap) mesenchyme (nm). (E) Anti-Tam-Horsfall protein (THP) antibodies detect the thick ascending limb (tal) of the loop of Henle. (F) Anti-Podocalyxin antibodies detect glomerular podocytes (pod). (G) Anti-Pdgfrβ antibodies detect mesangial cells (mes). (H) Anti-α-SMA antibodies detect medullary stromal cells (asterisks); while SMA-positive stromal cells are YFP-negative, labeling is observed in rare stroma-like α-SMA-negative cells (arrowhead). (I) Anti-Tenascin antibodies detect cortical stromal cells (asterisks). Scale bars 100μm in B, C, H and I; 50μm in D–G. Additional abbreviations: bc, Bowman’s capsule; c, cortex; ct, connecting tubule; m, medulla; p, pelvis; t, nephron tubules.
Figure 3
Figure 3. Ablation of nephron progenitor cells in early fetal kidneys causes progressive renal hypoplasia
(A) Strategy for partial depletion of nephron progenitor cells using GdnfCreERT2/+ and R26RDTA/+ mice. Blue circles represent nephron progenitors and yellow circles represent nephron progenitors ablated by DTA after tamoxifen (Tam) administration. (B) Kinetics of kidney growth in “DTA” vs. control fetuses after tamoxifen administration at E12.5. Average size of DTA kidneys, as a percentage of control, is indicated above the histogram for each stage. * P=0.0127, **** P<0.0001. Error bars indicate S.D. (C,D) Representative examples of control and DTA kidneys at E19.5. (E,F) Hematoxylin and eosin-stained histological sections, showing normal architecture of the DTA kidney (F) with well-formed cortex (c), medulla (m) and papilla (p). (G,H) Higher magnification images showing UB tips (black arrowheads), cap mesenchyme (yellow arrowheads) and early nephron structures (yellow dashed circles) in the nephrogenic zone of both control kidney (G) and a hypoplastic DTA kidney (H). a, adrenal; b, bladder; k, kidney; t, testis. Scale bars 500 μm in E, F and 50 μm in G, H. See also Figures S1 and S2.
Figure 4
Figure 4. Hypoplastic DTA kidneys compensate in organ size, but not in glomerular number, during the postnatal period, after tamoxifen administration at E12.5
(A–B) Measurement of total number of glomeruli per kidney at E19.5 and P50. (A) Method for counting glomeruli. Acid-digested kidneys were transferred to a gridded plate and glomeruli (indicated by arrowheads in inset) were counted using a dissecting microscope. (B) Quantification of glomeruli per kidney at E19.5 and postnatal day 50. Average glomerular number in DTA kidneys, as a percentage of control, is indicated above the histogram at each stage. ***P<0.0003. (C–D) Measurement of kidney size at P14 and P50. (C) Images of representative control and DTA kidneys at P14 and P50. (D) Quantification of the cross-sectional areas of control and DTA kidneys at E19.5, P14 and P50. Average DTA kidney size, as a percentage of control, is indicated above the histogram at each stage. E19.5 values are reproduced from Figure 3B. **** P<0.0001, **P=0.0013. Error bars indicate S.D.
Figure 5
Figure 5. Renal progenitors are still present at P1 but disappear by P4 in both control and DTA kidneys
Immunofluorescence with anti-SIX2 antibodies on thin frozen sections from animals injected with tamoxifen at E12.5 and analyzed at P1 (A–B), P2 (C–D), P3 (E–F) or P4 (G–H). A normal nephrogenic zone is present in control (A) and DTA littermates (B) at P1. Between P2 and P3, the SIX2+ progenitor population largely disappears in both controls (C, E) and DTA littermates (D, F). By P4 both control and DTA kidneys have lost the SIX2-positive nephron progenitor population (G–H). Asterisks indicate weakly SIX2-positive renal vesicles.
Figure 6
Figure 6. A transient reduction of cap mesenchyme cells in DTA kidneys is followed by a lasting retardation in UB branching
Tamoxifen was administered at E12.5 and the number of SIX2+ CM cells per UB tip (A–C), or the number of UB tips per kidney (D–F), was measured 24, 48 or 72 hrs later (i.e., at E13.5, E14.5, or E15.5, respectively). (A–B) Confocal images (optical sections) of E13.5 kidneys labeled with anti-SIX2 antibodies, showing the CM cells surrounding a representative UB tip in a control (A) or mutant (B) kidney. (C) Quantification of the numbers of SIX2+ CM cells per UB tip. SIX2+ cells were counted in a series of optical sections through each UB tip (see Figure S3 and Experimental Procedures for details). The variation in CM cell number per tip was large in control as well as DTA kidneys, because the UB tips and the surrounding mesenchyme caps vary in size, depending on the phase of the branching cycle. (D–E) 3D rendering of branching ureteric buds of control and mutant kidneys at E14.5. The kidneys were processed for whole-mount immunofluorescence with anti-Calbindin antibody and imaged using confocal microscopy and 3D rendering. (F) Quantification of total UB tips per kidney. Error bars indicate S.D. **** P<0.0001, ** P=0.0040. NS, not significant. UB tip cell mitosis and apoptosis assays are shown in Figure S4, and CM cell mitosis assays are shown in Figure S5.
Figure 7
Figure 7. Unlike the hypoplasia of Gdnf+/− kidneys, the hypoplasia of DTA kidneys cannot be rescued by removing one Sprouty1 allele
(A–C) representative kidneys of control, DTA and DTA; Spry1+/− fetuses at E19.5. Tamoxifen 2 mg was administered at E12.5. (D) quantification of the sizes of control, DTA and DTA; Spry1+/− kidneys. (E–G) representative kidneys of control, Gdnf+/− and Gdnf+/−; Spry1+/− fetuses at E19.5. (H) quantification of the sizes of control, Gdnf+/− and Gdnf+/−; Spry1+/− kidneys. **** P<0.0001, *** P<0.001, NS, not significant. a, adrenal; b, bladder; k, kidney. Error bars indicate S.D.

References

    1. Basson MA, Watson-Johnson J, Shakya R, Akbulut S, Hyink D, Costantini FD, Wilson PD, Mason IJ, Licht JD. Branching morphogenesis of the ureteric epithelium during kidney development is coordinated by the opposing functions of GDNF and Sprouty1. Dev Biol. 2006;299:466–477. - PubMed
    1. Benz K, Campean V, Cordasic N, Karpe B, Neuhuber W, Mall G, Hartner A, Hilgers KF, Amann K. Early glomerular alterations in genetically determined low nephron number. Am J Physiol Renal Physiol. 2011;300:F521–530. - PubMed
    1. Bertram JF, Douglas-Denton RN, Diouf B, Hughson MD, Hoy WE. Human nephron number: implications for health and disease. Pediatr Nephrol. 2011;26:1529–1533. - PubMed
    1. Boyle S, Misfeldt A, Chandler KJ, Deal KK, Southard-Smith EM, Mortlock DP, Baldwin HS, de Caestecker M. Fate mapping using Cited1-CreERT2 mice demonstrates that the cap mesenchyme contains self-renewing progenitor cells and gives rise exclusively to nephronic epithelia. Dev Biol. 2008;313:234–245. - PMC - PubMed
    1. Brunskill EW, Aronow BJ, Georgas K, Rumballe B, Valerius MT, Aronow J, Kaimal V, Jegga AG, Yu J, Grimmond S, et al. Atlas of gene expression in the developing kidney at microanatomic resolution. Dev Cell. 2008;15:781–791. - PMC - PubMed

Publication types