. 2014 Apr 10;7(1):281-92.
doi: 10.1016/j.celrep.2014.03.001. Epub 2014 Mar 20.

Systematic identification of regulatory elements in conserved 3' UTRs of human transcripts

Affiliations

Systematic identification of regulatory elements in conserved 3' UTRs of human transcripts

Panos Oikonomou et al. Cell Rep. .

Abstract

Posttranscriptional regulatory programs governing diverse aspects of RNA biology remain largely uncharacterized. Understanding the functional roles of RNA cis-regulatory elements is essential for decoding complex programs that underlie the dynamic regulation of transcript stability, splicing, localization, and translation. Here, we describe a combined experimental/computational technology to reveal a catalog of functional regulatory elements embedded in 3' UTRs of human transcripts. We used a bidirectional reporter system coupled with flow cytometry and high-throughput sequencing to measure the effect of short, noncoding, vertebrate-conserved RNA sequences on transcript stability and translation. Information-theoretic motif analysis of the resulting sequence-to-gene-expression mapping revealed linear and structural RNA cis-regulatory elements that positively and negatively modulate the posttranscriptional fates of human transcripts. This combined experimental/computational strategy can be used to systematically characterize the vast landscape of posttranscriptional regulatory elements controlling physiological and pathological cellular state transitions.


Figures

Figure 1
Figure 1. Identification of 3’UTR regulatory elements in human transcripts
(A) 34-nt conserved 3’UTR sequences were identified and synthesized on a custom microarray. Universal adapter primers were annealed on each probe, followed by primer extension. Single stranded DNA sequences were stripped and PCR amplified using universal adapters. Library sequences were cloned downstream of a fluorescent mCherry reporter in a bidirectional construct via recombination. (B) Transfection of the vector into human FlpIn-293 cells produced a library of FlpIn293 cells which stably expressed the bidirectional construct controlled by the 34-nt conserved 3’UTR sequences. Cells from this library were FACS-sorted into expression bins and analyzed via high-throughput sequencing. Based on over- and under- representation patterns for each sequence in each expression bin, sequences were predicted to be either gene expression repressors or activators. Results were further analyzed to identify new linear and structural RNA regulatory motifs. See also Table S1.
Figure 2
Figure 2. Sorting of Flp-In293 C3U Library into expression bins
(A) Cells were sorted into expression bins based on the Dual-reporter Intensity Ratio (DIR) of mCherry to GFP fluorescence. Each bin contains ~ 10% of the initial library. (B) Distributions of DIR for sorted populations exhibited a stable trend towards the sorted bin for the four low DIR bins (L10, L20, L30, L40) and the four high DIR bins (H10, H20, H30, H40). The differences between the median intensity ratios between each population and the library are shown. (C) Cumulative DIR distributions for validation populations with bidirectional reporters with re-cloned inserts from the initial sorted bins. Fifty independent clones were pooled together for each validation population. Shown are two replicates for each of two populations, cloned with inserts from low DIR sub-populations (val-L10) and H10 high DIR sub-populations (val-H10). Consistent with the origin of the inserts, the average DIR of val-L10 is significantly lower than the DIR of val-H10 populations (ΔR =0.35; p-value=7×10⁻⁵). See also Figure S1.
Figure 3
Figure 3. Validation of functional regulatory sequences as suppressors or activators of gene expression
(A) Each row represents a different 3’UTR sequence from the original library. 1st column: Log-fold over and under representation patterns in sorted expression bins for each sequence. The frequency of each sequence in a given sub-population was calculated from the high-throughput sequencing results and normalized to its frequency in the background population. Green distributions represent putative repressors (C3U-R840, q-value= 0.02; and C3U-R120, q-value=4×10⁻⁶) while red distributions represent putative activators (C3U-A452 q-value= 1.4×10⁻³; C3U-A626 q-value= 7×10⁻³). 2nd column: DIR distribution plots for clonal cell lines expressing the bidirectional reporter system with a single 3’UTR sequence (C3U-R840, C3U-R120, C3U-A452, C3U-A626). Distributions for each sequence (in color) compared to control cell lines containing shuffled versions of each sequence (black, C3U-R840-shuff, C3U-R120-shuff, C3U-A452-shuff, C3U-A626-shuff). Two replicate cell lines were produced for each sequence and its control. The difference, ΔR, in median DIR between the 3’UTR sequence under investigation and its shuffled control is reported in each panel. 3rd column: Quantitative PCR showing up- or down-regulation in mRNA levels relative to the shuffled controls for each sequence (data are represented as mean ±SEM, significant differences are marked by stars, *, p<0.05; **, p<0.01; ***, p<0.001.) (B,C) Representative microscopy images for C3U-R840 (B) and C3U-A452 (C) and their shuffled controls. GFP (green) and mCherry (red) images are shown individually and overlapped. See also Figure S2 and Table S3.
Figure 4
Figure 4. Known post-trascriptional regulatory target sites are informative of gene expression in the C3U library
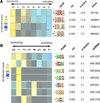
Shown are the over and under representation patterns for binding motifs of known RBPs (A) and sequences complementary to the first 8 nucleotides of known microRNAs (B) that were informative of gene expression in the C3U library. Sequences were clustered into eight sets, from those enriched in low-expression populations (left) to those enriched in high-expression populations (right). Reported are each motif’s primary sequence, the mutual information values and z-scores associated with a randomization-based statistical test. Yellow entries denote enrichment while blue entries denote significant depletion of a given motif in the corresponding cluster (for details see Elemento et al., 2007; also see Figure S3).
Figure 5
Figure 5. Discovery of Informative Post-transcriptional Regulatory Motifs
A partial list of structural RNA motifs discovered by TEISER (A) and linear RNA motifs discovered by FIRE (B) within the 3’UTR sequence library. For the complete sets see Fig. S3C and Fig. S3D. Sequences were clustered into eight sets as in Fig.4. Over representation (orange/yellow) and under representation (blue) patterns are shown for each discovered motif in the corresponding cluster. Reported are each motif’s assigned name, its primary sequence and for structural elements an illustration of its secondary structure using the following single letter nucleotide code: Y = [UC], R = [AG], K = [UG], M = [AC], S = [GC], W = [AU], B = [GUC], D = [GAU], H = [ACU], V = [GCA] and N = any nucleotide. Also shown are the mutual information values, z-scores associated with a randomization-based statistical test, robustness scores from a three-fold jackknifing test, and matches to target sequences of known regulators (for details see Elemento et al., 2007; Goodarzi et al., 2012). Also see Figures S3 and S4.
Figure 6
Figure 6. The regulatory consequences of the structural RNA motif C3U-SM1 on transcript abundance
(A) C3U-SM1’s sequence logo, secondary structure and three endogenous instances. (B) The effect of C3U-SM1 on gene expression. Two sets (C3U-SM1v1 and C3U-SM1v2) each comprising two different instances of C3U-SM1 from the C3U Library were cloned into the bidirectional reporter construct along with two different shuffled versions as controls (see Experimental Procedures). Two clonal populations were generated for each construct and the distribution of mCherry to GFP ratio (DIR) was measured using flow cytometry. (C) The mCherry transcript levels, as measured by quantitative PCR, were significantly lower in cells transiently transfected with C3U-SM1 constructs compared to the shuffled controls (data are represented as mean ±SEM, p-values = 4×10⁻⁵ and 1.5×10⁻⁵ respectively). (D) Representative microscopy images for bidirectional reporter cell lines containing C3U-SM1 instances vs. shuffled controls. GFP (green) and mCherry (red) images are shown overlapped. See also Figure S5 and Table S3.
Figure 7
Figure 7. C3U-SM1 is informative of cancer cell proliferation rates and patient outcome
(A) Gene expression profiles across five breast cancer cell lines were correlated with cell line doubling times. The resulting values were analyzed using TEISER and over- and under-representation patterns of transcripts are shown for C3U-SM1. Instances of C3U-SM1 are over represented in bins with positive correlation values for breast cancer cell lines. For genes with positive correlation values, high expression indicates low proliferation rates (p-value=10−7). (B) The aggregate expression level of transcripts with C3U-SM1 instances is lower for more advanced stage tumors (C) Patients with high aggregate expression levels in transcripts carrying C3U-SM1 in their 3’UTR showed better survival outcomes (N=459). The combined p-value for these three independent observations (Fisher’s method) is 10−8. See also Figure S6 and S7.

References

    1. Bartel DP. MicroRNAs: genomics, biogenesis, mechanism, and function. Cell. 2004;116:281–297. - PubMed
    1. Bartel DP. MicroRNAs: target recognition and regulatory functions. Cell. 2009;136:215–233. - PMC - PubMed
    1. Carrington JC, Ambros V. Role of MicroRNAs in Plant and Animal Development. Science. 2003;301:336–338. - PubMed
    1. Carthew RW, Sontheimer EJ. Origins and Mechanisms of miRNAs and siRNAs. Cell. 2009;136:642–655. - PMC - PubMed
    1. Chan CS, Elemento O, Tavazoie S. Revealing posttranscriptional regulatory elements through network-level conservation. PLoS computational biology. 2005;1:e69. - PMC - PubMed

Publication types

Associated data